March 2024

NSE Share Market Trends on 15 March 2024: Is the Short-lived Relief Rally Over?

Dive deep into the intricacies of the 15 March 2024 NSE Share Bazaar, dissecting the fluctuations of Nifty Fifty, Option Chain data, NiftyBank, and FII/DII activities to discern whether the relief rally is indeed transient or indicative of a broader market trend.

Nifty 50’s Volatile Journey on 15 March 2024

On the eventful day of 15 March 2024, the Nifty 50 index embarked on a journey marked by volatility and uncertainty. Opening with a notable loss of 82 points at 22,064.85, compared to the previous close of 22,146.65, it set the tone for a day of fluctuations.

Today’s NSE Share Bazaar

Nifty Spot’s Intriguing Highs and Lows

As the trading day commenced, the Nifty Spot surged to a notable high of 22,120.90, signaling potential bullish sentiment among traders. However, this optimism was short-lived as the index experienced a sharp decline, reaching a low of 21,931.70 around 11:10 AM.

Recovery Amidst Uncertainty

Despite the initial downturn, the Nifty demonstrated resilience and staged a recovery, climbing to a high of 22,050 near 3 PM. This resurgence amidst prevailing uncertainty left traders questioning the sustainability of the relief rally.

Analyzing Nifty’s Closure

Ultimately, the NSE Share Bazaar concluded with the Nifty 50 closing at 22,023.35, marking a marginal loss of 0.56% compared to the previous close. This modest decline, coupled with the day’s fluctuating performance, left traders pondering over the underlying market sentiment and future trajectory.

Insights into NiftyBank’s Performance

Parallel to Nifty’s journey, NiftyBank exhibited its own set of dynamics. Opening with a significant loss of 218 points at 46,572.10, compared to the previous close of 46,789.95, it mirrored the volatility witnessed in the broader market.

Comparative Analysis: Nifty vs. NiftyBank

While both indices experienced losses, NiftyBank’s performance appeared relatively robust. Despite the initial setback, it showcased resilience and recovery, closing at 46,594.10 with a loss of 0.42%, signaling potential strength within the banking sector amidst market fluctuations.

Deciphering FII/DII Activities

The 15th of March 2024 witnessed notable activity from Foreign Institutional Investors (FII) and Domestic Institutional Investors (DII), providing valuable insights into market sentiment and investment trends. FII bought 848.56 crores worth of equity in the cash segment, whereas DII sold 682.26 crores worth of equity, reflecting a nuanced interplay between institutional investors.

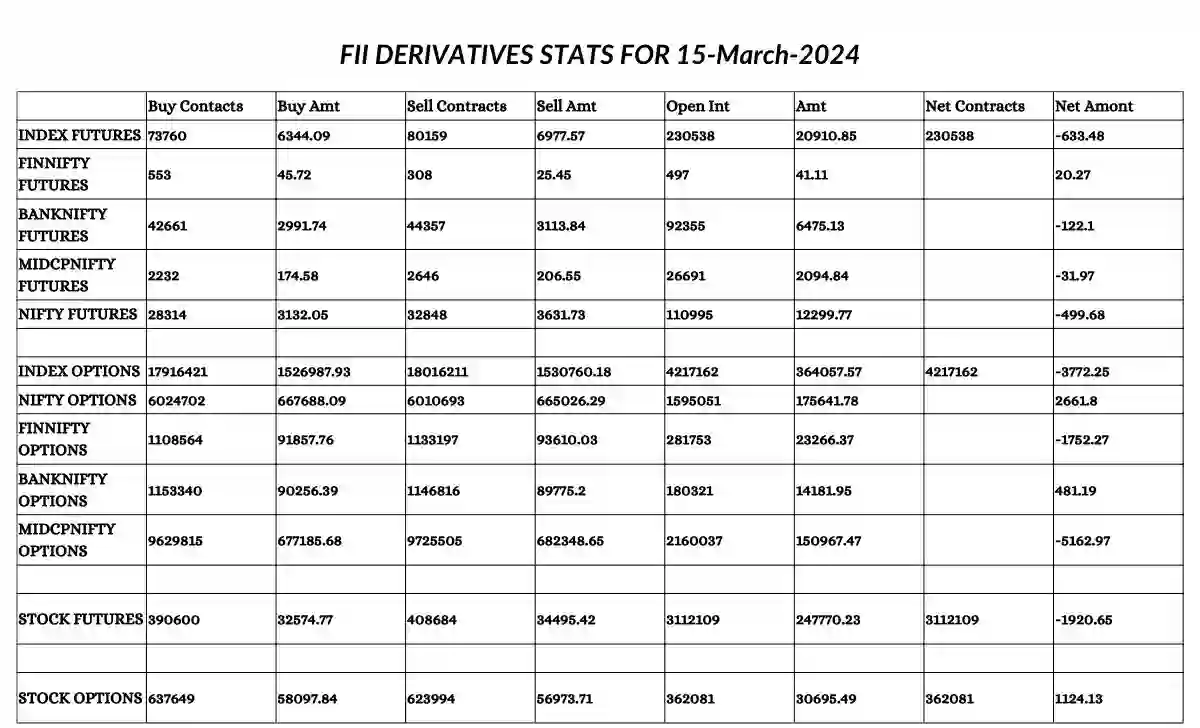
FII Derivative Statistics for 15 March 2024

You can refer to the image below containing the FII derivative statistics for 15 March 2024.

FII derivative stats For 15 March 2024

Long-to-Short Ratio Unveiled

A closer examination of FII’s long-to-short ratio in Index futures revealed intriguing insights into their positioning amidst market fluctuations. The ratio stood at 0.60, reflecting a shift in sentiment compared to the previous trading day, indicating potential adjustments in investment strategies.

Also Read:

Spotlight on Top Gainers and Losers

Within the Nifty Index, certain stocks emerged as top gainers and losers, providing further insights into market dynamics. UPL, BHARTIARTL, and HDFCLIFE were among the top gainers, while M&M, BPCL, and COALINDIA grappled with losses, highlighting the diverse performance within the market.

Navigating Through BankNifty’s Terrain

Exploring the highs and lows of BankNifty, alongside insights into the top gainers and losers within the banking sector, offers a comprehensive perspective on financial market trends and sectoral dynamics.

Unraveling Option Chain Data: Nifty

Delving into the option chain data for Nifty’s 21 March 2024 Expiry unveils significant changes in Open Interest Calls and Puts. Understanding these shifts provides valuable cues for market participants in navigating through market volatility and making informed trading decisions.

Decoding Option Chain Data: BankNifty

Similarly, analyzing BankNifty’s option chain data for the 20 March 2024 Expiry offers insights into notable shifts in Open Interest Calls and Puts. Deciphering these trends equips traders with valuable information to adapt their trading strategies and capitalize on market opportunities.

Exploring Sectoral Indices Performance on 15 March 2024

1. Nifty Next 50:

  • Open Price: The Nifty Next 50 index commenced trading on 15 March 2024 at 58,414.35.
  • High Price: It reached a peak of 58,661.10 during the trading session.
  • Low Price: The index saw a low of 57,184.20.
  • Closing Price: Concluding the day’s trading, the Nifty Next 50 settled at 58,058.80.
  • Previous Close: In comparison to the previous trading day, there was a decrease, marking a change of -0.79%.

2. Nifty Midcap 100:

  • Open Price: Trading began at 46,904.45 for the Nifty Midcap 100 index.
  • High Price: The index saw a high of 47,145.30.
  • Low Price: At its lowest point during the day, it reached 46,062.05.
  • Closing Price: Ending the trading session, the Nifty Midcap 100 closed at 46,685.60.
  • Previous Close: Compared to the previous trading day, there was a decrease, resulting in a change of -0.46%.

3. Nifty Auto:

  • Open Price: The Nifty Auto index opened trading at 20,475.60.
  • High Price: It reached a peak of 20,523.35.
  • Low Price: At its lowest point, the index dipped to 20,066.80.
  • Closing Price: Concluding the day, the Nifty Auto settled at 20,192.30.
  • Previous Close: There was a decrease compared to the previous trading day, with a change of -1.57%.

4. Nifty FMCG:

  • Open Price: Trading commenced at 54,013.95 for the Nifty FMCG index.
  • High Price: The index saw a high of 54,464.95.
  • Low Price: It reached a low of 53,886.70 during the trading session.
  • Closing Price: The Nifty FMCG concluded the day’s trading at 54,155.45.
  • Previous Close: Compared to the previous trading day, there was a slight increase, resulting in a change of 0.02%.

5. Nifty IT:

  • Open Price: The Nifty IT index started trading at 37,524.35.
  • High Price: It reached a high of 37,592.05 during the trading session.
  • Low Price: The index saw a low of 37,264.90.
  • Closing Price: Ending the day’s trading, the Nifty IT settled at 37,500.70.
  • Previous Close: There was a decrease compared to the previous trading day, with a change of -0.47%.

6. Nifty Metal:

  • Open Price: The Nifty Metal index commenced trading at 7,802.05.
  • High Price: It reached a high of 7,855.45 during the trading session.
  • Low Price: At its lowest point, the index dipped to 7,684.85.
  • Closing Price: Concluding the day, the Nifty Metal settled at 7,802.65.
  • Previous Close: There was a slight increase compared to the previous trading day, resulting in a change of 0.03%.

7. Nifty Pharma:

  • Open Price: Trading began at 18,876.80 for the Nifty Pharma index.
  • High Price: The index saw a high of 18,916.20.
  • Low Price: At its lowest point during the day, it reached 18,588.85.
  • Closing Price: Ending the trading session, Nifty Pharma closed at 18,718.45.
  • Previous Close: Compared to the previous trading day, there was a decrease, marking a change of -0.95%.

8. Nifty PSU Bank:

  • Open Price: The Nifty PSU Bank index opened trading at 6,779.80.
  • High Price: It reached a high of 6,855.20 during the trading session.
  • Low Price: At its lowest point, the index dipped to 6,574.40.
  • Closing Price: Concluding the day, the Nifty PSU Bank settled at 6,761.00.
  • Previous Close: There was a decrease compared to the previous trading day, with a change of -0.35%.

9. Nifty Oil & Gas:

  • Open Price: Trading commenced at 11,202.55 for the Nifty Oil & Gas index.
  • High Price: The index saw a high of 11,269.50.
  • Low Price: It reached a low of 10,770.15 during the trading session.
  • Closing Price: Ending the day’s trading, the Nifty Oil & Gas closed at 11,058.80.
  • Previous Close: There was a decrease compared to the previous trading day, resulting in a change of -1.98%.

Analyzing these sectoral indices provides investors with insights into the performance of specific sectors within the broader market, aiding in portfolio diversification and strategic decision-making.

Market Sentiment and Future Prospects

Assessing the prevailing market sentiment and anticipating future market trends based on technical analysis, institutional activities, and global economic indicators enables traders to formulate informed strategies and navigate effectively in dynamic market environments.

Conclusion: The Verdict on Market Stability

In conclusion, while the 15 March 2024 NSE Share Bazaar showcased resilience amidst volatility, the lingering uncertainty prompted traders to tread cautiously and reassess their positions. The question remains whether the relief rally is indeed short-lived or indicative of a broader market trend, underscoring the importance of adaptability and vigilance in navigating through ever-evolving market landscapes.

NSE Share Market Trends on 15 March 2024: Is the Short-lived Relief Rally Over? Read More »
Expert Analysis: Are We Past the Bull Market Peak? Insights from Siddhartha Bhaiya

Gain valuable insights into the current state of the stock market as Siddhartha Bhaiya predicts a 60–70% probability of being past the bull market peak. Explore expert analysis on potential big corrections in the small-cap index and make informed investment decisions.

Introduction: The Wisdom of Siddhartha Bhaiya

Siddhartha Bhaiya’s expertise in the realm of stock market analysis is widely acknowledged, making his perspectives highly sought after by investors. In his recent appearance on NDTV Profit’s “Talking Point,” Bhaiya shared his insights into the current state of the stock market. Understanding his perspective is crucial for investors looking to navigate the complexities of the financial markets effectively.

Also Read: Stress Test Results for Mid and Small-Cap Investors

Siddhartha Bhaiya’s Recent Successes

Bhaiya’s track record in predicting market movements has been notably accurate, garnering him a reputation for having a keen insight into market dynamics. By examining his recent successes, investors can gain a deeper understanding of his approach to market analysis and the factors he considers when making predictions.

Are We Past the Bull Market Peak?

Market Excesses and Cautionary Signals

During the interview, Bhaiya highlighted the presence of significant market excesses, particularly in the small-cap segment. The unprecedented surge in the small-cap index over the past four years has raised concerns about overvaluation and potential market corrections. Bhaiya’s cautious stance serves as a warning to investors to tread carefully in the current market environment.

“Market excesses” refer to situations within financial markets where certain assets or sectors become overvalued or experience significant price inflation beyond their intrinsic worth or fundamental value. These excesses can manifest in various forms, such as rapid price increases, speculative trading activity, or unsustainable valuations relative to earnings or other financial metrics.

In practical terms, market excesses may occur when investor sentiment becomes overly optimistic, leading to a frenzy of buying activity that drives asset prices to levels disconnected from their underlying fundamentals. This phenomenon often occurs during bull markets when investors’ confidence and risk appetite are high.

For example, in the context of the stock market, market excesses may be evident in the form of inflated price-to-earnings ratios, excessive speculation in certain sectors or stocks, or a widespread disregard for traditional valuation metrics. Such conditions can create an environment ripe for a market correction or reversal, as prices may eventually revert to more reasonable levels in line with economic fundamentals.

Recognizing market excesses is essential for investors as they can serve as warning signs of potential market instability or downturns. Prudent investors may adjust their investment strategies or portfolio allocations in response to these signals to mitigate risks and preserve capital.

Also Read: Unraveling the Mystery Behind Market Corrections

Have We Past the Bull Market Peak?

Bhaiya’s assertion of a high probability of the bull market reaching its peak has garnered attention from investors and analysts alike. By analyzing historical market data and current market trends, Bhaiya arrives at his assessment, suggesting that caution is warranted amidst the possibility of a market downturn.

Economic Growth vs. Market Peaks

A critical aspect of Bhaiya’s analysis involves contrasting economic growth projections with market performance. Despite optimistic economic outlooks, Bhaiya warns that market peaks often coincide with periods of exuberance and excessive optimism. Understanding this dynamic is essential for investors to gauge the potential risks associated with market fluctuations.

“Contrasting economic growth projections with market performance” involves comparing forecasts for economic growth with the actual performance of financial markets.

Economic growth projections typically provide estimates of a country’s expected GDP (Gross Domestic Product) growth rate over a specific period, often based on factors such as government policies, consumer spending, business investment, and global economic trends. These projections serve as indicators of the overall health and direction of the economy.

On the other hand, market performance refers to the behavior and movements of financial markets, including stock exchanges, bond markets, and commodity markets. Market performance is influenced by various factors, including investor sentiment, corporate earnings, interest rates, geopolitical events, and economic indicators.

Contrasting economic growth projections with market performance involves examining whether the actual performance of financial markets aligns with the anticipated economic growth. In some cases, markets may react positively to robust economic growth forecasts, with stock prices rising and investor confidence increasing. Conversely, disappointing economic growth figures may lead to market downturns or volatility as investors adjust their expectations and investment strategies.

Discrepancies between economic growth projections and market performance can provide valuable insights into market sentiment, investor behavior, and the effectiveness of economic policies. Understanding these dynamics can help investors make more informed decisions about asset allocation, risk management, and portfolio diversification.

Also Read: A Deep Dive into Small Caps vs Large Caps

The Role of Insider Activity

Bhaiya emphasizes the importance of scrutinizing insider activities within the market as a key indicator of market health. Shifts in promoter behavior and international MNC actions provide valuable insights into market sentiment and potential future market movements. By closely monitoring insider activity, investors can gain a better understanding of prevailing market conditions.

The Ripple Effect on Market Segments

Bhaiya’s observations extend beyond the small-cap segment, encompassing potential ramifications for large-cap and mid-cap stocks. Market dynamics often trigger ripple effects across various sectors, impacting investor sentiment and market performance. Understanding these interconnected dynamics is crucial for investors seeking to diversify their portfolios effectively.

Managing Portfolio Risks

In light of the market uncertainties, Bhaiya advocates for prudent risk management strategies to safeguard investment portfolios. By adjusting portfolio allocations and diversifying across asset classes, investors can mitigate the potential impact of market volatility. Bhaiya’s emphasis on proactive risk management underscores the importance of adopting a disciplined approach to investing.

Also Read: Market Analysis FY24

Market Volatility and Investor Behavior

Bhaiya’s cautious stance resonates with concerns surrounding heightened market volatility and shifting investor behavior. The influx of retail investors into the market has introduced additional complexities, contributing to increased market volatility. Understanding the implications of changing investor behavior is crucial for investors to navigate turbulent market conditions effectively.

Lessons from Market History

Drawing parallels from historical market cycles, Bhaiya offers invaluable insights into navigating uncertain market environments. By studying past market trends and outcomes, investors can glean valuable lessons to inform their investment decisions. Bhaiya’s emphasis on learning from market history underscores the importance of adopting a long-term perspective and staying vigilant amidst evolving market conditions.

Expert Analysis: Are We Past the Bull Market Peak? Insights from Siddhartha Bhaiya Read More »

Relief Rally? 14 March 2024 NSE Share Bazaar Analysis & Insights

Delve into the intricacies of the 14 March 2024 NSE Share Bazaar performance, exploring the Nifty 50, NiftyBank, and Option Chain dynamics. Uncover expert insights to discern whether it’s a relief rally or a market’s bottom, backed by FII/DII data.

Market Overview on 14 March 2024

The 14 March 2024 NSE Share Bazaar commenced with anticipation as investors eagerly awaited the unveiling of market movements. The opening bell echoed with a subtle hint of caution as the Nifty Fifty initiated its journey with a minor setback, shedding 15 points compared to the previous day’s close. This initial dip hinted at underlying market tensions. However, amidst the early morning haze, the Nifty Spot experienced a brief descent to 21,917.50, only to swiftly rebound within a mere 20 minutes, showcasing the resilience of market bulls. The rollercoaster ride continued as bears attempted to exert dominance, yet the market once again found its footing, scaling to a commendable day high of 22,204.60. Finally, as the closing bell tolled, the NSE Share Bazaar painted a picture of optimism, clinching a gain of 0.68% and settling at 22,146.65, leaving investors with a mix of relief and anticipation for the days ahead.

Today’s NSE Share Bazaar

Nifty 50 Performance

The Nifty 50, often regarded as the barometer of the Indian stock market, offered a fascinating spectacle on 14 March 2024. Despite the initial stumble, it exhibited remarkable resilience, culminating in a notable gain of 0.68% by the day’s end. This performance underscored the underlying strength of select stocks within the index, propelling the market toward positive territory. The fluctuations observed throughout the trading session reflected the dynamic interplay between market forces, providing investors with valuable insights into the prevailing sentiment.

NiftyBank Analysis

In stark contrast to the Nifty 50’s buoyancy, NiftyBank navigated through choppy waters on 14 March 2024. Opening with a notable loss of 156 points, it struggled to find its footing amidst prevailing market pressures. The divergence between NiftyBank and Nifty 50 highlighted the sector-specific challenges plaguing banking stocks. Despite a valiant effort to recover lost ground, NiftyBank concluded the day with a 0.41% loss, signaling caution within the banking sector and prompting investors to reevaluate their portfolios in light of sectoral dynamics.

FII/DII Data Insights

The activities of Foreign Institutional Investors (FIIs) and Domestic Institutional Investors (DIIs) on 14 March 2024 provided invaluable insights into market sentiment. FIIs, wielding significant influence, opted to offload equities in the cash segment, amounting to a substantial sell-off of 1,356.29 crores. Conversely, DIIs seized the opportunity to bolster their portfolios, injecting 139.47 crores into the cash segment. This tug-of-war between FIIs and DIIs underscored the nuanced intricacies of market dynamics, leaving investors pondering over the implications of institutional actions on future market movements.

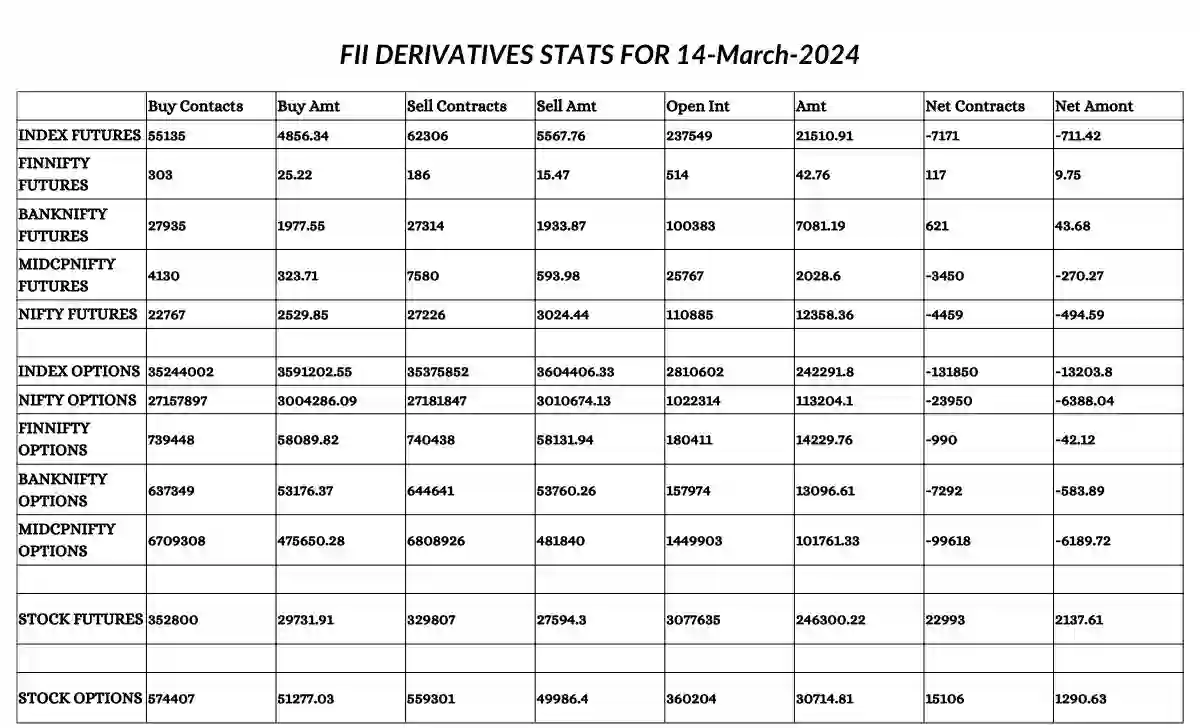
FII Derivative Statistics for 14 March 2024

You can save the image below for the FII derivative statistics for 14 March 2024.

FII derivative stats For 14 March 2024

Relief Rally or Bottoming Out?

Amidst the ebbs and flows of the market on 14 March 2024, a pivotal question loomed large: Was it merely a relief rally or had the market truly found its bottom? The dichotomy between short-term optimism and long-term structural shifts fueled speculation among investors. While the day’s gains provided a glimmer of hope, the underlying uncertainties lingered, prompting investors to tread cautiously and seek clarity amidst the fog of market volatility.

NIFTY Spot Analysis

The NIFTY Spot, serving as a focal point for market activity, underwent meticulous scrutiny on 14 March 2024. Post-options expiry, it witnessed a flurry of activity, oscillating between highs and lows, mirroring the broader market sentiment. The resilience displayed by NIFTY Spot amidst market turbulence served as a testament to the underlying strength of the market, instilling confidence among investors and stakeholders alike.

Option Chain Dynamics: NIFTY

The option chain dynamics of NIFTY on 14 March 2024 offered a window into the intricacies of derivatives trading. Analysis of open interest for both calls and puts revealed notable changes, shedding light on market sentiment and investor expectations. The top three changes in open interest for calls and puts provided valuable insights into prevailing market sentiment, guiding investors in formulating informed trading strategies.

Option Chain Dynamics: BANKNIFTY

Similarly, the option chain dynamics of BANKNIFTY on 14 March 2024 unraveled a tapestry of market intricacies. Noteworthy changes in open interest for calls and puts offered a glimpse into the sector-specific dynamics influencing banking stocks. By deciphering these changes, investors gained a deeper understanding of market projections and potential avenues for strategic positioning.

Also Read:

Sectoral Performance

NIFTY NEXT 50:

  • Open: The NIFTY NEXT 50 index commenced trading on 14 March 2024 at 56,938.45.
  • High: It reached its peak at 58,639.85 during the trading session.
  • Low: The index experienced a low of 56,430.85 at a certain point in the day.
  • Close: Finally, it closed the trading day at 58,520.20.
  • Previous Close: Comparatively, the previous day’s closing value stood at 57,149.55.
  • Change: This indicates a notable gain of 2.40% for the NIFTY NEXT 50 index on 14 March 2024.

NIFTY MIDCAP 100:

  • Open: On 14 March 2024, the NIFTY MIDCAP 100 index opened trading at 45,658.10.
  • High: It reached its highest point during the session at 46,979.75.
  • Low: The index experienced a low of 45,293.35 throughout the trading period.
  • Close: Ultimately, it concluded trading at 46,901.20.
  • Previous Close: The index’s previous day’s closing value was 45,971.40.
  • Change: This denotes a noteworthy gain of 2.02% for the NIFTY MIDCAP 100 index on 14 March 2024.

NIFTY AUTO:

  • Open: Trading for the NIFTY AUTO index on 14 March 2024 commenced at 20,235.05.
  • High: It peaked at 20,569.25 during the day’s trading activities.
  • Low: At its lowest point, the index recorded a value of 20,169.85.
  • Close: Ultimately, it wrapped up trading at 20,514.25.
  • Previous Close: The index’s closing value on the previous day was 20,338.25.
  • Change: This signifies a modest gain of 0.87% for the NIFTY AUTO index on 14 March 2024.

NIFTY FMCG:

  • Open: Trading began for the NIFTY FMCG index on 14 March 2024 at 53,504.40.
  • High: It reached its peak at 54,252.45 during the trading session.
  • Low: The index experienced a low of 53,280.20 at a certain point during the day.
  • Close: It concluded trading at 54,145.80.
  • Previous Close: The index’s closing value on the previous day was 53,664.15.
  • Change: This indicates a modest gain of 0.90% for the NIFTY FMCG index on 14 March 2024.

NIFTY IT:

  • Open: The NIFTY IT index commenced trading on 14 March 2024 at 36,901.90.
  • High: It reached its highest point during the session at 37,723.35.
  • Low: At its lowest point, the index recorded a value of 36,607.65.
  • Close: Ultimately, it wrapped up trading at 37,679.60.
  • Previous Close: The index’s closing value on the previous day was 36,946.45.
  • Change: This denotes a notable gain of 1.98% for the NIFTY IT index on 14 March 2024.

NIFTY METAL:

  • Open: Trading commenced for the NIFTY METAL index on 14 March 2024 at 7,663.50.
  • High: It reached its peak at 7,814.40 during the day’s trading activities.
  • Low: The index experienced a low of 7,591.85 during the trading period.
  • Close: It concluded trading at 7,799.95.
  • Previous Close: The index’s closing value on the previous day was 7,647.40.
  • Change: This signifies a notable gain of 1.99% for the NIFTY METAL index on 14 March 2024.

NIFTY PHARMA:

  • Open: Trading began for the NIFTY PHARMA index on 14 March 2024 at 18,632.05.
  • High: It reached its peak at 18,919.60 during the trading session.
  • Low: At its lowest point, the index recorded a value of 18,517.60.
  • Close: Ultimately, it wrapped up trading at 18,897.10.
  • Previous Close: The index’s closing value on the previous day was 18,635.70.
  • Change: This denotes a modest gain of 1.40% for the NIFTY PHARMA index on 14 March 2024.

NIFTY PSU BANK:

  • Open: The NIFTY PSU BANK index commenced trading on 14 March 2024 at 6,709.20.
  • High: It reached its highest point during the session at 6,847.10.
  • Low: The index experienced a low of 6,641.25 at a certain point during the day.
  • Close: Ultimately, it wrapped up trading at 6,784.65.
  • Previous Close: The index’s closing value on the previous day was 6,737.45.
  • Change: This signifies a modest gain of 0.70% for the NIFTY PSU BANK index on 14 March 2024.

NIFTY OIL & GAS:

  • Open: Trading began for the NIFTY OIL & GAS index on 14 March 2024 at 11,004.00.
  • High: It reached its peak at 11,310.20 during the trading session.
  • Low: At its lowest point, the index recorded a value of 10,956.80.
  • Close: Ultimately, it wrapped up trading at 11,281.85.
  • Previous Close: The index’s closing value on the previous day was 11,025.40.
  • Change: This signifies a notable gain of 2.33% for the NIFTY OIL & GAS index on 14 March 2024.

Top Gainers and Losers

The identification of top gainers and losers within Nifty 50 and NiftyBank indices on 14 March 2024 offered invaluable insights into market movers and shakers. Stocks such as ADANIENT, ADANIPORTS, and HINDALCO emerged as top gainers, underscoring the underlying strength of select sectors. Conversely, stocks such as AXISBANK, INDUSINDBK, and BAJFINANCE grappled with losses, reflecting sector-specific challenges and market pressures. This comprehensive analysis empowered investors to make informed decisions, capitalizing on emerging opportunities and mitigating potential risks.

The 14 March 2024 NSE Share Bazaar unfolded with intriguing twists and turns, leaving investors pondering over its underlying dynamics. With meticulous analysis and keen insights into various facets such as index performance, FII/DII activities, and option chain dynamics, a clearer picture emerges, guiding investors through the labyrinth of market fluctuations. As the market oscillates between optimism and skepticism, deciphering the trajectory becomes paramount, delineating between a mere relief rally and a more profound structural shift in market sentiment.

Relief Rally? 14 March 2024 NSE Share Bazaar Analysis & Insights Read More »

Unlocking the Future: Ethereum’s Dencun Upgrade Revolutionizes Scalability

Dive into the transformative potential of Ethereum’s Dencun upgrade, reshaping scalability in the crypto sphere. Explore insights from industry experts, dissecting the impact on prices, industry dynamics, and the convergence of AI and crypto.

The Bitcoin ETF Surge: Unveiling the Driving Forces

The recent surge in Bitcoin’s value has been nothing short of spectacular, leaving many investors curious about the underlying catalysts. One significant contributor to this surge is the emergence of Bitcoin exchange-traded funds (ETFs), which have injected substantial liquidity into the market. These ETFs have not only garnered attention due to their financial viability but also because they symbolize a broader endorsement of Bitcoin as a legitimate asset class.

Decrypting the Bitcoin Halving Phenomenon

A cornerstone event in the Bitcoin ecosystem, the halving phenomenon, is often shrouded in speculation and anticipation. While it’s true that the reduction in Bitcoin issuance contributes to its scarcity, the halving event’s impact extends beyond mere economics. It serves as a catalyst for renewed interest and media attention, propelling Bitcoin back into the limelight and stimulating investor sentiment.

Ethereum's Dencun Upgrade

Dragonfly Insights: A Glimpse into ETF Inflows

Insights from Dragonfly provide invaluable data on ETF inflows, painting a picture of institutional interest in Bitcoin. With billions flowing into ETFs within a single week, it’s evident that investors are eagerly awaiting regulatory approval to access Bitcoin through traditional brokerage accounts. This influx of institutional capital signals a paradigm shift in Bitcoin’s adoption and acceptance within mainstream finance.

Also Read: Bitcoin’s Slip Below $68,000

Institutional Endorsement: Larry Fink’s Perspective

The endorsement of prominent figures like Larry Fink further solidifies Bitcoin’s position as a viable asset class. Fink’s public statements praising Bitcoin’s potential underscore its growing legitimacy and pave the way for greater institutional involvement. Beyond mere endorsements, such affirmations serve to demystify Bitcoin for traditional investors, fostering broader acceptance and adoption.

Also Read: Ethereum ETFs Delayed

Sustained Momentum or an Impending Correction: What Lies Ahead?

While the current momentum is undeniably bullish, the question lingers: Is this sustainable, or are we on the brink of a correction? The intersection of macroeconomic factors, institutional adoption, and regulatory developments will likely dictate Bitcoin’s trajectory in the coming months. While short-term fluctuations are inevitable, the long-term outlook remains optimistic, driven by fundamental shifts in perception and adoption.

Ethereum’s Dencun Upgrade Unveiled

Turning our attention to Ethereum, the impending Dencun upgrade represents a significant milestone in its evolutionary journey. At the heart of this upgrade lies the quest for smart contract scalability, a crucial step towards democratizing access to decentralized finance. By reducing transaction fees and enhancing efficiency, Ethereum’s scalability improvements promise to unlock a new wave of innovation and adoption.

The Ethereum Dencun upgrade, also known as Cancun-Deneb, officially launched on March 13, 2024, marking a significant milestone in Ethereum’s evolution. This major upgrade is designed to enhance the scalability and efficiency of the Ethereum network, addressing key challenges that have hindered its widespread adoption.

One of the primary highlights of the Dencun upgrade is its focus on reducing transaction fees, particularly on layer-2 networks. These layer-2 solutions are integral components built atop the Ethereum blockchain to alleviate congestion and improve transaction throughput. By lowering transaction fees associated with these layer-2 networks, Dencun aims to make utilizing Ethereum-based applications more cost-effective for users, thereby enhancing accessibility and usability.

It’s important to note that Dencun is implemented as a hard fork, leading to a divergence in the Ethereum blockchain. This split results in the creation of two separate chains, each following its own set of rules and protocols. However, despite this division, the overarching goal of the upgrade remains consistent: to propel Ethereum towards greater scalability and efficiency.

For those interested in delving into the technical intricacies of the Dencun upgrade, exploring Ethereum Improvement Proposals (EIPs) is recommended. EIPs serve as detailed proposals outlining specific changes and enhancements introduced as part of the upgrade. By examining these proposals, enthusiasts and developers alike can gain deeper insights into the underlying modifications driving Ethereum’s evolution.

In summary, the Ethereum Dencun upgrade represents a significant step forward for the Ethereum ecosystem, ushering in improvements aimed at fostering scalability, efficiency, and accessibility. As the Ethereum network continues to evolve, innovations like Dencun play a pivotal role in shaping its trajectory and expanding its capabilities to meet the demands of a rapidly growing decentralized ecosystem.

Also Read: Unlocking the Future of NFTs

Democratizing access to decentralized finance

“Democratizing access to decentralized finance” refers to the concept of making financial services and products available to a broader and more inclusive audience through decentralized platforms and protocols. Traditionally, accessing financial services often requires individuals to rely on centralized institutions such as banks, which can have barriers to entry such as account minimums, geographic limitations, and bureaucratic processes.

Decentralized finance, or DeFi, aims to disrupt this traditional model by leveraging blockchain technology to create open, permissionless, and trustless financial systems. In a decentralized finance ecosystem, individuals have direct control over their assets and can access a wide range of financial services without the need for intermediaries.

By “democratizing access,” DeFi platforms aim to:

  1. Eliminate Barriers: DeFi protocols remove barriers to entry, allowing anyone with an internet connection to participate in financial activities regardless of their location, income level, or background.
  2. Increase Accessibility: DeFi platforms are accessible 24/7, enabling users to transact, borrow, lend, trade, and invest at any time without being subject to the limitations of traditional banking hours.
  3. Reduce Costs: DeFi protocols typically operate with lower fees compared to traditional financial services, making it more affordable for users to access financial products and services.
  4. Empower Individuals: DeFi puts financial control back into the hands of individuals by allowing them to manage their assets directly, without the need for intermediaries or third-party oversight.
  5. Enable Innovation: DeFi fosters innovation by providing a platform for developers to create and deploy new financial products and services rapidly. This innovation can lead to the creation of novel solutions tailored to the needs of a diverse global audience.

Overall, the goal of democratizing access to decentralized finance is to create a more inclusive and equitable financial system that empowers individuals and communities to participate in the global economy on their terms.

Layer 2 Solutions: Empowering Ethereum’s Scalability

Central to Ethereum’s scalability strategy are Layer 2 solutions, which serve as mini blockchains running alongside the main Ethereum network. These solutions optimize transaction throughput and reduce congestion, making decentralized applications more accessible and cost-effective. With Dencun significantly reducing fees for these Layer 2 networks, Ethereum’s scalability becomes not just a vision but a tangible reality.

Also Read: Unveiling Bitcoin’s Meteoric Rise

“Mini blockchains” refer to secondary or auxiliary blockchains that operate alongside a main blockchain, such as Ethereum, within a broader blockchain network. These mini blockchains, also known as sidechains or Layer 2 solutions, serve specific functions to enhance the scalability, efficiency, and functionality of the main blockchain.

Here’s a breakdown of key characteristics and functions of mini blockchains:

  1. Scalability Solutions: Mini blockchains are designed to alleviate congestion and scalability limitations on the main blockchain by offloading certain transactions or computations to separate chains. This allows for increased transaction throughput and reduced processing times.
  2. Specialized Functions: Mini blockchains can be tailored to perform specific functions or tasks, such as handling micropayments, executing smart contracts, or facilitating token transfers. By dedicating separate chains to these functions, developers can optimize performance and efficiency.
  3. Interoperability: Mini blockchains are often interoperable with the main blockchain, meaning that assets and data can be seamlessly transferred between the main chain and sidechains. This interoperability facilitates the exchange of value and information across different layers of the blockchain network.
  4. Enhanced Security: While mini blockchains operate independently, they typically rely on the security of the main blockchain for consensus and validation of transactions. This ensures that transactions conducted on sidechains remain secure and immutable, leveraging the robustness of the broader blockchain network.
  5. Reduced Costs: By processing transactions off-chain or on separate sidechains, mini blockchains can help reduce transaction fees and gas costs associated with executing transactions on the main blockchain. This makes decentralized applications more affordable and accessible to users.

Overall, mini blockchains play a crucial role in enhancing the scalability, functionality, and usability of blockchain networks like Ethereum. By leveraging these auxiliary chains, developers can create more efficient and versatile decentralized applications that meet the growing demands of users and stakeholders in the blockchain ecosystem.

AI and Crypto: Analyzing the CoinBase Report

CoinBase‘s report on AI and crypto sheds light on an intriguing intersection within the digital asset landscape. The outperformance of AI-related crypto tokens vis-a-vis traditional cryptocurrencies hints at broader market dynamics and investor sentiment. However, a deeper analysis reveals that much of this rally is driven by narrative rather than tangible fundamentals, necessitating caution amid the hype.

When someone says, “this rally is driven by narrative rather than tangible fundamentals,” they are suggesting that the increase in value or price of a particular asset, such as a cryptocurrency, is primarily fueled by stories, perceptions, or speculative beliefs rather than by concrete, measurable factors like earnings, revenue, or technological advancements.

In simpler terms, it means that people are buying or investing in the asset because of the story or narrative surrounding it, rather than because of any solid evidence or data supporting its underlying value. This narrative-driven behavior often leads to increased volatility and can result in prices becoming disconnected from the asset’s intrinsic worth.

For example, in the context of cryptocurrency, a coin may experience a surge in value because of hype around a new partnership, an upcoming upgrade, or endorsements from influential figures, rather than because of any fundamental improvements to its technology or utility. In such cases, investors are drawn to the excitement and momentum generated by these narratives, driving up demand and prices.

However, without strong fundamentals supporting the asset’s value, such rallies can be fragile and prone to sudden reversals or corrections when the narrative loses momentum or proves to be unfounded. Therefore, investors should be cautious when participating in rallies driven primarily by narrative, as they may be susceptible to significant losses if market sentiment shifts abruptly.

Also Read: Bitcoin Surges, ETF Momentum

The Nexus of AI and Decentralization: A Contrarian Perspective

While the allure of decentralized AI models is undeniable, skepticism regarding their practicality persists. Despite the narrative surrounding decentralized AI tokens, actual adoption and usage remain limited, casting doubt on the sustainability of their valuations. However, ongoing research and innovation in this space offer glimpses of potential future breakthroughs, underscoring the need for vigilant observation.

Forecasting the Crypto Landscape: AI, Dencun Upgrade, and Bitcoin Halving

In conclusion, the convergence of AI advancements, Ethereum’s Dencun Upgrade, and the upcoming Bitcoin halving heralds a transformative era for the crypto landscape. While short-term market dynamics may fluctuate, the underlying trends point towards a maturing ecosystem characterized by innovation and accessibility. As venture capital firms like Dragonfly continue to explore investment opportunities across various sectors, the future of crypto appears poised for sustained growth and evolution.

Unlocking the Future: Ethereum’s Dencun Upgrade Revolutionizes Scalability Read More »

Unraveling the Mystery Behind Market Corrections: Insights from Kotak Mahindra AMC

Delve into the intricacies of market corrections as Kotak Mahindra AMC sheds light on the role of stress tests and the unwinding of market excesses. Gain valuable insights into investment strategies amidst volatile market conditions.

Understanding Market Dynamics

Nilesh Shah, representing Kotak Mahindra AMC, is a prominent figure in the financial industry known for his expertise and insights. As a key spokesperson for the AMC, Nilesh Shah often provides valuable perspectives on market trends, investment strategies, and economic developments. With a wealth of experience and a deep understanding of the intricacies of the financial markets, Nilesh Shah plays a significant role in shaping discussions and guiding investors toward informed decision-making.

Market volatility can often seem mysterious, with sudden corrections leaving investors puzzled. In a recent discussion with Nilesh Shah on CNBC TV18, the nuances of these corrections were explored, shedding light on the underlying factors driving market fluctuations.

Unraveling the Mystery Behind Market Corrections

Debunking Stress Test Myths

Contrary to popular belief, stress tests are not the root cause of market corrections. As per Kotak Mahindra AMC, these tests serve as a reassurance rather than a trigger for market downturns. By analyzing the market’s performance over the past year, it becomes evident that stress tests alone cannot account for significant corrections.

Also Read: Are We Past the Bull Market Peak?

Stress tests are assessments conducted in the financial industry to evaluate the resilience and stability of financial institutions, such as banks and mutual funds, under adverse economic conditions. These tests simulate various scenarios, including economic downturns, market volatility, and other stress factors, to determine how well financial institutions can withstand such conditions without experiencing significant losses or disruptions. The purpose of stress tests is to identify potential vulnerabilities within the financial system and ensure that institutions have sufficient capital reserves and risk management strategies in place to mitigate potential risks.

Also Read: A Deep Dive into Small Caps vs Large Caps

Market Correction: Unwinding of Market Excesses

One key insight provided by Kotak Mahindra AMC is the role of excesses in market corrections. The surge in returns seen in small and micro-cap stocks over the past year has led to a natural unwinding of these excesses. This correction reflects the market’s self-correcting mechanism rather than the outcome of stress tests.

The role of excesses in market corrections refers to the phenomenon where inflated valuations or speculative behaviors lead to a correction or adjustment in the financial markets. Excesses can manifest in various forms, such as excessively high stock prices, unsustainable levels of borrowing, or speculative bubbles in certain asset classes. When these excesses reach unsustainable levels, they create imbalances in the market that eventually result in a correction.

During a correction, market participants reassess the true value of assets and adjust their investments accordingly. This process often involves selling overvalued assets, which can lead to a decline in prices and a correction in the market. The correction serves to realign asset prices with their underlying fundamentals, restoring equilibrium to the market.

The role of excesses in market corrections highlights the importance of prudent investing and risk management. Investors should be cautious of speculative excesses and avoid chasing unsustainable returns. By recognizing and addressing excesses in the market, investors can better navigate periods of volatility and mitigate the impact of corrections on their investment portfolios.

Mutual Fund Stability Amidst Uncertainty

Despite market turbulence, mutual funds remain stable pillars of investment. Kotak Mahindra AMC emphasizes the importance of staying invested and highlights the resilience of mutual fund distributors in navigating challenging market conditions.

Also Read: Market Analysis FY24

Identifying Investment Opportunities

In the midst of market corrections, opportunities for strategic investments emerge. Kotak Mahindra AMC suggests that investors should view these downturns as opportunities to enhance their equity allocations, particularly in small and mid-cap stocks through mutual funds.

Liquidity Dynamics and Deployment Strategies

The discussion also delves into the liquidity position of the mutual fund industry and strategies for deploying available funds. While liquidity is abundant, Kotak Mahindra AMC emphasizes the importance of prudent investment decisions, especially in the face of desperate selling.

Valuation Considerations in PSU Stocks

The conversation extends to the valuation dynamics of PSU stocks, with insights into potential corrections and buying opportunities. Kotak Mahindra AMC advises investors to exercise caution and assess fair value amidst market fluctuations.

Promoter Exits and Valuation Insights

The significance of promoter exits in evaluating company valuations is explored, with Kotak Mahindra AMC emphasizing the need for thorough due diligence. Understanding the motives behind promoter exits is crucial in making informed investment decisions.

Also Read: Unlocking the Potential

The motives behind promoter exits refer to the reasons or intentions that drive company founders or major shareholders to sell their ownership stakes in a company. Promoter exits can occur for various reasons, and understanding these motives is essential for investors evaluating the implications of such actions.

One common motive behind promoter exits is the need for liquidity. Promoters may choose to sell their shares to unlock capital for personal reasons, such as diversifying their investment portfolio, funding other ventures, or meeting financial obligations. Additionally, promoters may opt to sell their stakes to raise funds for business expansion or to address corporate debt.

Another motive for promoter exits is strategic realignment. Promoters may sell their shares as part of a strategic restructuring or reorganization of the company. This could involve bringing in new investors or strategic partners to support the company’s growth plans or to streamline operations.

Promoter exits can also be driven by changes in the business environment or industry dynamics. If promoters believe that the company’s growth prospects have diminished or that market conditions are unfavorable, they may choose to sell their shares to mitigate their exposure to risk.

Furthermore, personal considerations and succession planning can influence promoter exits. Promoters may decide to exit their positions to retire or transition leadership responsibilities to the next generation of management. Succession planning ensures continuity and stability within the company’s leadership structure.

In summary, the motives behind promoter exits can vary widely and may encompass financial, strategic, and personal considerations. By understanding these motives, investors can assess the implications of promoter exits on the company’s future prospects and make informed investment decisions.

The Role of Vision and Money

Drawing on the age-old adage, the discussion touches upon the dynamics between vision and financial resources in investment decisions. Kotak Mahindra AMC underscores the importance of aligning vision with financial strategies for long-term success in the market.

Aligning vision with financial strategies refers to the process of ensuring that one’s long-term goals and aspirations are supported by sound financial planning and decision-making. It involves harmonizing one’s personal or organizational vision with practical financial measures to achieve desired outcomes effectively.

Firstly, it requires clarifying and articulating a clear vision or set of goals. Whether it’s achieving financial independence, expanding a business, or funding a particular project, having a well-defined vision provides a guiding light for financial strategies.

Next, it involves assessing current financial resources and capabilities. This includes evaluating income streams, assets, liabilities, and risk tolerance levels. Understanding the financial landscape allows individuals or organizations to make realistic plans and allocate resources effectively to support their vision.

Once the vision and financial situation are understood, the next step is to develop strategies that align with both. This may involve setting specific financial targets, such as savings goals, investment returns, or revenue projections, that are in line with the overarching vision.

Furthermore, it requires prioritizing and making trade-offs to allocate resources efficiently. Not every financial opportunity or expenditure will directly contribute to achieving the vision, so it’s essential to focus on investments or expenses that have the greatest impact on goal attainment.

Regular monitoring and adjustment are also crucial components of aligning vision with financial strategies. Economic conditions, market trends, and personal circumstances may change over time, requiring adaptations to the financial plan to stay on track towards achieving the vision.

Ultimately, aligning vision with financial strategies is about integrating long-term aspirations with practical financial management principles. By ensuring that financial decisions support and reinforce the broader vision, individuals and organizations can maximize their chances of success and fulfillment.

Also Read: Expert Analysis: Midcap Index is Overvalued

Conclusion: Navigating Market Volatility

In conclusion, the discussion with Kotak Mahindra AMC provides valuable insights into navigating market volatility. By understanding the underlying factors driving corrections and staying informed about investment opportunities, investors can navigate turbulent market conditions with confidence and prudence.

In essence, market corrections are not mere haphazard events but rather intricately woven phenomena influenced by various factors. By unraveling these complexities and leveraging expert insights, investors can navigate market fluctuations with resilience and foresight.

Unraveling the Mystery Behind Market Corrections: Insights from Kotak Mahindra AMC Read More »

A Deep Dive into 13 March 2024 NSE Share Bazaar: Unveiling the Mystery of Unusual Market Movements

Explore the intriguing events of 13 March 2024 in the NSE Share Market, featuring the Nifty Fifty’s unexpected twists, the resilience of NiftyBank, and the enigmatic FII/DII data. Delve into the intricate details and uncover the secrets behind the market fluctuations.

The Opening Bell: A Promising Start

The 13th of March 2024 dawned with optimism in the NSE Share Bazaar as the Nifty Fifty showcased a promising opening, marking a significant gain of 97 points at 22,432.20 compared to the previous day’s close. However, the day’s events would soon take a tumultuous turn.

Today’s NSE Share Bazaar

Rollercoaster Ride: Nifty Fifty’s Dramatic Fluctuations

On 13 March 2024, the Nifty opened with a gain of 97 points at 22,432.20 compared to the previous day’s close. However, the optimism was short-lived as the index experienced significant fluctuations throughout the trading session. The day saw the Nifty reaching a high of 22,446.75 at the opening but ultimately closing at 21,997.70, marking a loss of 1.51% from the previous day’s close.

Notable movements within the Nifty index included top gainers such as ITC, ICICIBANK, and KOTAKBANK, while top losers included POWERGRID, COALINDIA, and ADANIENT. These stocks played a significant role in influencing the index’s overall performance for the day.

The Resilient Banks: Saviors of the Day

On 13 March 2024, BankNifty opened with a gain of 59 points at 47,341.15 compared to the previous day’s close. Unlike the broader market, BankNifty exhibited relative strength and resilience throughout the trading session. The index reached a high of 47,468.70 and a low of 46,842.15 before closing at 46,981.30, marking a loss of -0.64% from the previous day’s close.

Heavyweight banks such as ICICIBANK, KOTAKBANK, and HDFCBANK played a significant role in influencing BankNifty’s performance for the day. However, there were notable underperformers as well, including BANDHANBNK, PNB, and BANKBARODA, which contributed to the index’s overall decline.

Institutional Influence: FII/DII Dynamics on 13 March 2024

The day witnessed intriguing activities in the FII/DII domain. Foreign Institutional Investors (FIIs) sold 4,595.06 crores in the cash segment, while Domestic Institutional Investors (DIIs) counteracted with a substantial purchase of 9,093.72 crores worth of equity. Despite concerted efforts by DIIs, the market remained volatile, raising questions about hidden market dynamics.

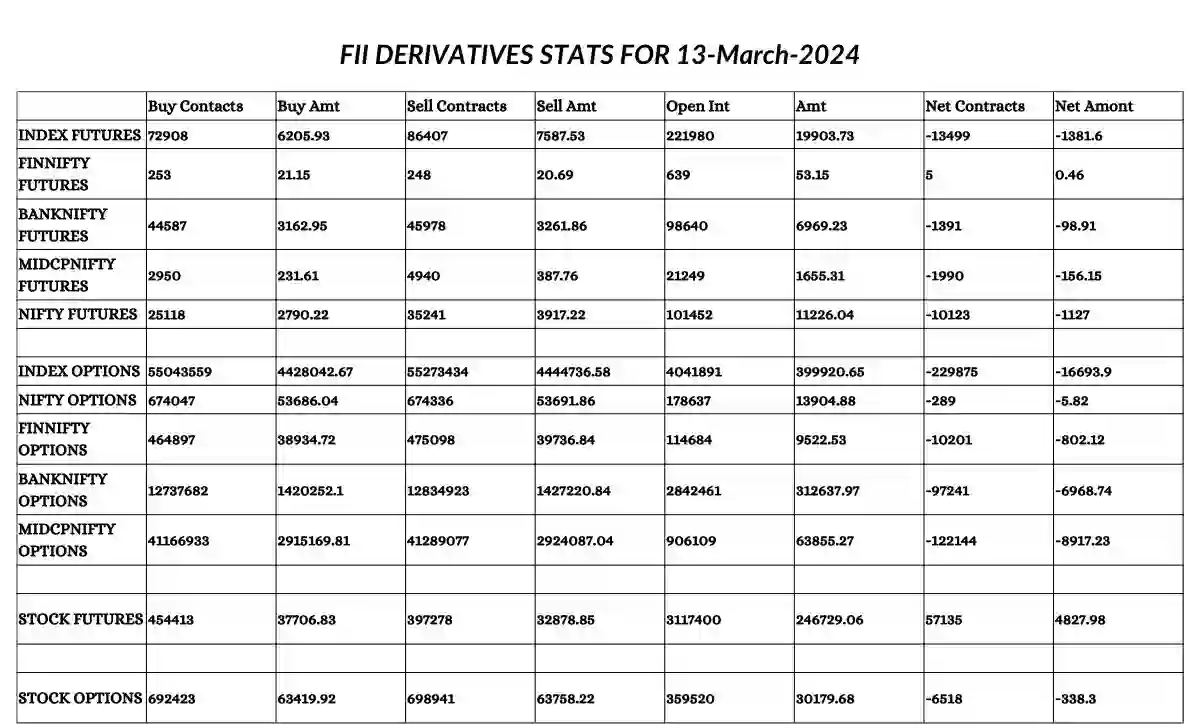
FII Derivative Statistics for 13 March 2024

You can save the image below for the FII derivative statistics for 13 March 2024.

FII derivative stats For 13 March 2024

Sectoral Insights: Unveiling the Real Picture

A closer examination of sectoral indices reveals the true extent of the market’s descent. While the headline index may reflect modest declines, sector-specific indices offer a more nuanced perspective, highlighting the breadth of the market turmoil.

Also Read:

The Curious Case of Nifty Options

Option chain data for Nifty presents a puzzle for market enthusiasts. Notable changes in open interest for both calls and puts hints at divergent market sentiments and potential strategies adopted by market participants.

Deciphering BankNifty Options

Similarly, the option chain data for BankNifty provides insights into market expectations and potential price movements. Significant changes in open interest for calls and puts underscore the intricate interplay of market forces.

Spectral Indices: Unraveling Market Segments

  • NIFTY NEXT 50: The Nifty Next 50 index, comprising the next set of 50 stocks after the Nifty Fifty, opened at 59,466.80 on 13 March 2024. However, the day saw a significant downturn as it closed at 57,149.55, marking a substantial decrease of 3.75% from the previous day’s close at 59,377.20. High volatility was evident as the index experienced a wide range, with the highest point reaching 59,661.80 and the lowest dropping to 56,716.85. The Nifty Next 50’s performance is closely watched as it represents emerging companies with the potential to ascend to the prestigious Nifty Fifty index, providing insights into broader market sentiment and the trajectory of smaller-cap stocks.
  • NIFTY MIDCAP 100: In contrast to the Nifty Next 50, the Nifty Midcap 100 index reflects the performance of the top 100 mid-sized companies listed on the NSE. On 13 March 2024, the index opened at 48,190.05 but closed significantly lower at 45,971.40, registering a decline of 4.4% from the previous day’s close at 48,086.85. Throughout the trading session, the index experienced fluctuations, with the highest point recorded at 48,278.00 and the lowest dropping to 45,656.85. The Nifty Midcap 100’s performance is closely monitored as it offers insights into the growth potential and resilience of mid-sized companies, often considered a barometer of economic health and investor sentiment.
  • NIFTY AUTO: The Nifty Auto index, comprising stocks from the automobile sector, opened at 20,942.25 on 13 March 2024. However, the day saw a notable decline as it closed at 20,338.25, marking a decrease of 2.84% from the previous day’s close at 20,931.85. Throughout the trading session, the index experienced fluctuations, with the highest point reaching 20,988.55 and the lowest dropping to 20,211.20. The performance of the Nifty Auto index is closely tied to consumer demand, economic growth, and regulatory developments within the automotive industry, making it a key indicator of sectoral health and market sentiment.
  • NIFTY FMCG: The Nifty FMCG index, comprising stocks from the fast-moving consumer goods sector, opened at 54,844.50 on 13 March 2024. Despite minor fluctuations, the index closed marginally higher at 53,664.15, registering a slight increase of 0.05% from the previous day’s close at 53,636.10. Throughout the trading session, the index reached a high of 54,962.50 and a low of 53,470.25. The performance of the Nifty FMCG index is closely monitored as it reflects consumer spending patterns, brand performance, and broader economic trends, providing insights into both domestic consumption and investor sentiment toward FMCG companies.
  • NIFTY IT: The Nifty IT index, comprising stocks from the information technology sector, opened at 37,320.80 on 13 March 2024. However, the day saw a decline as it closed at 36,946.45, marking a decrease of 0.75% from the previous day’s close at 37,224.25. Throughout the trading session, the index experienced fluctuations, with the highest point recorded at 37,556.60 and the lowest dropping to 36,689.10. The performance of the Nifty IT index is closely linked to global technology trends, outsourcing demand, and currency fluctuations, making it a crucial indicator of India’s position in the global IT landscape and investor sentiment towards technology stocks.
  • NIFTY METAL: The Nifty Metal index, comprising stocks from the metal sector, opened at 8,110.85 on 13 March 2024. However, the day saw a significant decline as it closed at 7,647.40, marking a decrease of 5.69% from the previous day’s close at 8,108.40. Throughout the trading session, the index experienced fluctuations, with the highest point recorded at 8,121.20 and the lowest dropping to 7,578.35. The performance of the Nifty Metal index is closely tied to global commodity prices, industrial demand, and macroeconomic factors, making it a key indicator of sectoral health and economic activity.
  • NIFTY PHARMA: The Nifty Pharma index, comprising stocks from the pharmaceutical sector, opened at 19,219.30 on 13 March 2024. However, the day saw a decline as it closed at 18,495.00, marking a decrease of 1.70% from the previous day’s close at 18,635.70. Throughout the trading session, the index experienced fluctuations, with the highest point recorded at 18,961.20 and the lowest dropping to 19,022.20. The performance of the Nifty Pharma index is closely monitored as it reflects both domestic and international factors affecting the pharmaceutical industry, including regulatory developments, drug approvals, and healthcare trends.
  • NIFTY PSU BANK: The Nifty PSU Bank index, comprising stocks from the public sector banks, opened at 7,054.55 on 13 March 2024. However, the day saw a decline as it closed at 6,737.45, marking a decrease of 4.28% from the previous day’s close at 7,039.00. Throughout the trading session, the index experienced fluctuations, with the highest point recorded at 7,088.25 and the lowest dropping to 6,683.15. The performance of the Nifty PSU Bank index is closely tied to government policies, economic indicators, and sector-specific developments, serving as a key indicator of the health of public sector banks and broader banking sector sentiment.
  • NIFTY OIL & GAS: The Nifty Oil & Gas index, comprising stocks from the oil and gas sector, opened at 11,613.95 on 13 March 2024. However, the day saw a decline as it closed at 11,025.40, marking a decrease of 4.87% from the previous day’s close at 11,589.30. Throughout the trading session, the index experienced fluctuations, with the highest point recorded at 11,619.45 and the lowest dropping to 10,973.65. The performance of the Nifty Oil & Gas index is closely linked to global crude oil prices, geopolitical factors, and domestic policy decisions, making it a crucial indicator of sectoral health and energy market dynamics.

Top Performers and Underdogs

Identifying the top gainers and losers within the Nifty and BankNifty indices sheds light on prevailing market trends and sectoral dynamics, guiding investors in their decision-making processes.

The Aftermath: Implications and Future Outlook

As the dust settles on the 13th of March 2024, market participants reflect on the day’s events and anticipate the implications for future trading sessions. Uncertainties linger, but informed analysis and strategic positioning may pave the way for navigating turbulent market waters.

In conclusion, the events of 13 March 2024 in the NSE Share Bazaar offer a fascinating glimpse into the complexities of financial markets. From the Nifty Fifty’s dramatic fluctuations to the resilience of banking stocks and the enigmatic FII/DII data, each aspect unveils a piece of the larger puzzle, inviting further exploration and analysis in the ever-evolving landscape of the NSE Share Market.

A Deep Dive into 13 March 2024 NSE Share Bazaar: Unveiling the Mystery of Unusual Market Movements Read More »

A Deep Dive into Small Caps vs Large Caps: Unlocking Market Insights with Samir Arora

Dive into a detailed breakdown of market insights shared by Samir Arora. Uncover the nuances of small caps vs large caps investments, regulatory influences, and strategic investment approaches.

Chance Encounter with Ray Dalio: Insights from the Airport Conversation

Samir Arora reflects on a serendipitous meeting with renowned investor Ray Dalio at the airport. Despite the unexpected nature of the encounter, it provided a platform for discussing market principles. Arora mentions his cautious approach, refraining from divulging his prior knowledge of Dalio’s work. Instead, he initiated the conversation by referencing books on investment principles. This anecdote sheds light on the informal nature of networking in the financial world and the value of seizing opportunities for insightful discussions.

Small Caps vs Large Caps

Ray Dalio is a prominent American investor, hedge fund manager, and philanthropist. Born on August 8, 1949, in Queens, New York, Dalio is best known as the founder of Bridgewater Associates, one of the world’s largest hedge funds. He is recognized for his unique investment philosophy and principles-based approach to financial markets.

Dalio began his career on Wall Street in the 1970s, initially working as a commodities trader. In 1975, he founded Bridgewater Associates from his two-bedroom apartment in New York City. Over the years, he grew the firm into a global powerhouse with assets under management reaching hundreds of billions of dollars.

What sets Dalio apart is his commitment to understanding economic cycles and market patterns. He developed a systematic approach to investing based on principles such as “radical transparency” and “believability-weighted decision-making.” His principles are outlined in his book “Principles: Life and Work,” which became a bestseller and gained widespread acclaim for its insights into leadership and decision-making.

Beyond his success in the financial world, Dalio is also known for his philanthropy. Along with his wife, Barbara, he signed the Giving Pledge, committing to donate the majority of his wealth to charitable causes. The Dalio Foundation supports initiatives in education, healthcare, and other areas aimed at improving societal well-being.

Ray Dalio’s influence extends far beyond the realm of finance. His innovative approach to investing and commitment to philanthropy have solidified his reputation as one of the most influential figures in the global financial community.

Also Read: Market Analysis FY24

The Reality of Small Caps vs Large Caps: Dispelling Myths and Analyzing Performance

Delving into the realm of small-cap investments, Samir Arora debunks common misconceptions surrounding their performance. Contrary to popular belief, small caps do not consistently outperform large caps. Arora emphasizes the cyclical nature of market trends, citing historical data to support his argument. By analyzing past market phases, he highlights instances where small caps experienced temporary surges but ultimately reverted to underperforming large caps. This nuanced perspective challenges conventional wisdom and encourages investors to adopt a more cautious approach when considering small-cap investments.

Also Read: Unraveling the Mystery Behind Market Corrections

Analyzing Small Cap Performance: Lessons from Previous Phases

Drawing insights from previous market phases, Samir Arora offers valuable lessons on small-cap performance. Through a retrospective lens, he examines the fluctuations in small-cap indices over the years. Arora underscores the importance of understanding market cycles and recognizing patterns to make informed investment decisions. By studying historical data, investors can gain a deeper understanding of market dynamics and anticipate potential shifts in performance trends.

Also Read: Unlocking the Potential: How Bull Runs Transform Midcap & Smallcap Stocks

The Impact of Retail Investors: Shifting Dynamics in Market Participation

Discussing the evolving landscape of market participation, Samir Arora explores the influence of retail investors on small-cap investments. He observes a growing trend of retail investors driving market sentiment, particularly in the realm of small-cap stocks. Arora acknowledges the significance of retail investors’ contributions but cautions against overly optimistic outlooks. By analyzing market dynamics and investor behavior, he underscores the need for a balanced approach to portfolio management.

Regulatory Messaging and Market Sentiment: The Role of External Factors

Examining the interplay between regulatory messaging and market sentiment, Samir Arora highlights the impact of external factors on investor behavior. He references recent regulatory statements and their implications for market participants. Arora emphasizes the importance of staying informed about regulatory developments and their potential ramifications on investment strategies. By assessing regulatory trends, investors can better navigate market uncertainties and adjust their portfolios accordingly.

Budget Speculations: Evaluating Market Reactions and Investment Opportunities

Amid speculations surrounding budget announcements, Samir Arora analyzes their potential impact on market sentiments. He discusses investment strategies in anticipation of budgetary changes and uncertainties. Arora emphasizes the need for proactive portfolio management and strategic planning in response to budget-related developments. By evaluating market reactions and identifying investment opportunities, investors can position themselves for success amidst evolving economic landscapes.

Privatization Prospects: Assessing PSU Banks and Market Optimism

Delving into privatization prospects in PSU banks, Samir Arora assesses market optimism and investment opportunities in the sector. He discusses the potential implications of privatization on market dynamics and investor sentiment. Arora shares his bullish outlook on PSU banks, citing fundamental factors and market indicators. By evaluating privatization prospects and market sentiments, investors can make informed decisions about their portfolios and capitalize on emerging opportunities.

Also Read: Expert Analysis: Midcap Index is Overvalued

Investment Philosophy Amidst Market Volatility: Strategies for Long-Term Gains

Reflecting on investment philosophies amidst market volatility, Samir Arora offers insights into strategic approaches for long-term gains. He emphasizes the importance of maintaining a disciplined investment strategy and focusing on fundamental analysis. Arora encourages investors to adopt a patient mindset and avoid succumbing to short-term market fluctuations. By prioritizing long-term objectives and staying true to their investment principles, investors can navigate market volatility with confidence.

Market Dynamics and Investor Behavior: Insights from Samir Arora

Drawing on his extensive experience, Samir Arora shares insights into market dynamics and investor behavior. He discusses the interconnectedness of market factors and their impact on investment decisions. Arora emphasizes the need for continuous learning and adaptation in response to changing market conditions. By staying informed and remaining adaptable, investors can enhance their understanding of market dynamics and make informed investment choices.

The interconnectedness of market factors refers to the complex relationship between various elements that influence financial markets. These factors can include economic indicators, geopolitical events, investor sentiment, corporate earnings, and regulatory policies, among others. Each of these factors is interconnected, meaning that changes in one area can have ripple effects throughout the entire market ecosystem.

For example, an unexpected change in government policy can impact investor confidence, leading to fluctuations in stock prices. Similarly, shifts in global economic conditions, such as changes in interest rates or inflation rates, can affect the profitability of companies and industries, thereby influencing investment decisions.

Understanding the interconnectedness of these factors is crucial for investors when making decisions about buying, selling, or holding assets. By analyzing how different market factors interact with one another, investors can better anticipate market trends and adjust their strategies accordingly.

Additionally, the interconnectedness of market factors highlights the importance of diversification in investment portfolios. By spreading investments across different asset classes and industries, investors can mitigate risk and reduce the impact of adverse market events in any one area.

Overall, recognizing the interconnected nature of market factors underscores the need for a comprehensive approach to investment analysis. By considering the broader economic and geopolitical landscape, as well as specific market dynamics, investors can make more informed decisions to achieve their financial objectives.

Also Read: Navigating Regulatory Challenges

Future Outlook and Investment Strategies: Optimizing Portfolios for Success

Looking ahead to the future, Samir Arora provides insights into investment strategies and portfolio optimization. He discusses the importance of staying attuned to market trends and identifying emerging opportunities. Arora emphasizes the need for diversification and risk management in portfolio construction. By adopting a proactive approach to investment management, investors can position themselves for success and achieve their long-term financial objectives.

Through a comprehensive analysis of Samir Arora’s insights, investors can gain a deeper understanding of market dynamics, regulatory influences, and strategic investment approaches. By incorporating these insights into their investment strategies, investors can navigate the complexities of the financial markets with confidence and achieve their financial goals.

A Deep Dive into Small Caps vs Large Caps: Unlocking Market Insights with Samir Arora Read More »

Mystery Behind 12 March 2024: Who is the Hidden Seller in the Market?

Explore the turbulence of the 12 March 2024 NSE Stock Market, from the surprising Nifty 50 fluctuations to the hidden seller puzzle, all dissected in this insightful analysis. Dive into Option Chain dynamics, NIFTY Spot movements, and FII/DII data to unravel the mysteries of the trading day.

Today’s NSE Share Bazaar

Unraveling the Chaos: 12 March 2024 NSE Stock Market Overview

On the 12th of March 2024, the Nifty 50 market opened with an unexpected flatline, only to erupt into a whirlwind of activity shortly after. With an initial gain of 2 points at 22,334.45, optimism seemed to pervade. However, within minutes, the market plunged 15 points, signaling early volatility. What followed was a rollercoaster ride of fluctuations, with Nifty experiencing a staggering 100-point surge by 10:25 AM, only to nosedive nearly 200 points shortly after. This erratic behavior persisted throughout the day, with the Nifty Spot eventually closing flat, hinting at underlying instability that traders should tread cautiously around.

NiftyBank: A Tale of Synchronicity and Divergence

Parallel to the Nifty 50’s drama, the NiftyBank embarked on a similar journey on the 12th of March 2024. Opening with a modest gain of 24 points at 47,351.35, it mirrored Nifty’s volatility. However, the Bank Nifty displayed a slight weakness in comparison, reaching a high of 47,812.75 before plummeting to a low of 46,884.45. Ultimately, it closed with a marginal loss of -0.10%, accentuating the synchronized yet distinct narrative unfolding in the NSE Share Bazaar.

Institutional Players and the Puzzle of Market Movements

Amidst the market chaos, institutional players, namely Foreign Institutional Investors (FII) and Domestic Institutional Investors (DII), made significant moves. FII’s long-to-short ratio in Index futures saw a notable increase, indicating strategic positioning. On the other hand, both FII and DII displayed a collective interest in the cash segment, with notable purchases of 73.12 crores and 2,358.18 crores, respectively. Despite these investments, a glaring disparity between institutional actions and market trends emerges, begging the question: who is the hidden seller influencing market dynamics?

FII Derivative Statistics for 12 March 2024

You can save the image below for the FII derivative statistics for 12 March 2024.

FII derivative stats For 12 March 2024

Also Read:

Deciphering Market Indices: A Window into Sectoral Trends

  • NIFTY NEXT 50: Exploring Emerging Trends: The NIFTY NEXT 50 index serves as a barometer for the performance of the next tier of large-cap companies after the NIFTY 50. Comprised of promising contenders poised for growth, this index offers a glimpse into emerging trends and future market leaders. On the 12th of March 2024, the NIFTY NEXT 50 witnessed a decline of 1.55%, reflecting broader market sentiments. Despite this setback, individual stock performances within the index unveil diverse trajectories, with some companies resilient amidst market turmoil while others falter. Analyzing the NIFTY NEXT 50 provides investors with insights into evolving market dynamics and opportunities within the realm of emerging enterprises.
  • NIFTY MIDCAP 100: Uncovering Mid-Segment Resilience: The NIFTY MIDCAP 100 index encapsulates the performance of mid-sized companies, offering a snapshot of the mid-segment’s resilience and growth potential. Despite facing a decline of 1.41% on the 12th of March 2024, the index remains a focal point for investors seeking exposure beyond blue-chip stocks. Individual stock movements within the NIFTY MIDCAP 100 index reveal a tapestry of performances, with some companies weathering market volatility admirably while others succumb to downward pressure. By scrutinizing the NIFTY MIDCAP 100, investors gain insights into the health of mid-sized enterprises and opportunities for diversification beyond traditional market heavyweights.
  • NIFTY AUTO: Riding the Waves of Automotive Dynamics: The NIFTY AUTO index tracks the performance of the automotive sector, encompassing manufacturers, suppliers, and ancillary companies. Amidst fluctuating consumer demand, regulatory changes, and technological advancements, the automotive sector remains a dynamic landscape for investors. On the 12th of March 2024, the NIFTY AUTO index experienced a marginal decline of 0.33%, reflecting the sector’s resilience amidst broader market uncertainties. However, individual stock performances within the index unveil nuanced narratives, with some companies outperforming peers through innovative strategies and market adaptability. Analyzing the NIFTY AUTO index provides investors with insights into evolving automotive dynamics and opportunities within this ever-evolving sector.
  • NIFTY FMCG: Exploring Consumer Trends and Preferences: The NIFTY FMCG index offers a window into consumer trends, preferences, and spending patterns within the fast-moving consumer goods sector. Comprising companies engaged in producing essential household items, personal care products, and packaged foods, this index remains a bellwether for consumer sentiment and economic health. On the 12th of March 2024, the NIFTY FMCG index witnessed a decline of 0.83%, reflective of broader market pressures and shifting consumer behaviors. However, individual stock performances within the index reveal nuanced stories of resilience and adaptation, with some companies navigating challenges adeptly while others face headwinds. By dissecting the NIFTY FMCG index, investors gain insights into evolving consumer dynamics and opportunities within this vital sector.
  • NIFTY IT: Navigating Technological Evolution: The NIFTY IT index tracks the performance of the information technology sector, encompassing software developers, IT services providers, and technology manufacturers. In an era of rapid technological evolution and digital transformation, the IT sector remains a cornerstone of innovation and growth. On the 12th of March 2024, the NIFTY IT index experienced a modest increase of 0.64%, reflecting the sector’s resilience amidst broader market uncertainties. However, individual stock performances within the index unveil diverse trajectories, with some companies leveraging emerging technologies to drive growth while others grapple with competitive pressures. Analyzing the NIFTY IT index provides investors with insights into evolving technological landscapes and opportunities within this dynamic sector.
  • NIFTY METAL: Riding the Waves of Industrial Dynamics: The NIFTY METAL index tracks the performance of the metal sector, encompassing producers of steel, aluminum, copper, and other industrial metals. Amidst fluctuating global demand, supply chain disruptions, and trade tensions, the metal sector remains a barometer for industrial dynamics and economic health. On the 12th of March 2024, the NIFTY METAL index experienced a decline of 1.73%, reflective of broader market uncertainties and subdued industrial sentiments. However, individual stock performances within the index unveil nuanced narratives, with some companies are resilient amidst challenges while others face operational headwinds. Analyzing the NIFTY METAL index provides investors with insights into evolving industrial landscapes and opportunities within this essential sector.
  • NIFTY PHARMA: Navigating Healthcare Dynamics: The NIFTY PHARMA index tracks the performance of the pharmaceutical sector, encompassing manufacturers of prescription drugs, generic medicines, and healthcare products. In an era of global health crises, regulatory scrutiny, and scientific breakthroughs, the pharmaceutical sector remains a critical pillar of healthcare infrastructure. On the 12th of March 2024, the NIFTY PHARMA index witnessed a decline of 1.27%, reflective of broader market pressures and regulatory uncertainties. However, individual stock performances within the index unveil diverse narratives, with some companies pioneering innovation while others contend with regulatory challenges. Analyzing the NIFTY PHARMA index provides investors with insights into evolving healthcare landscapes and opportunities within this vital sector.
  • NIFTY PSU BANK: Unveiling Financial Sector Dynamics: The NIFTY PSU BANK index tracks the performance of public sector banks, offering insights into financial sector dynamics and economic health. Amidst regulatory reforms, asset quality concerns, and macroeconomic trends, the PSU banking sector remains a focal point for investors seeking exposure to India’s banking landscape. On the 12th of March 2024, the NIFTY PSU BANK index witnessed a decline of 2.57%, reflective of broader market uncertainties and sector-specific challenges. However, individual stock performances within the index unveil nuanced narratives, with some banks navigating challenges adeptly while others grapple with operational inefficiencies. Analyzing the NIFTY PSU BANK index provides investors with insights into evolving financial landscapes and opportunities within this critical sector.
  • NIFTY OIL & GAS: Navigating Energy Sector Dynamics: The NIFTY OIL & GAS index tracks the performance of the energy sector, encompassing companies engaged in the exploration, production, refining, and distribution of oil and gas products. In an era of shifting energy policies, geopolitical tensions, and environmental concerns, the oil and gas sector remains a focal point for investors seeking exposure to energy markets. On the 12th of March 2024, the NIFTY OIL & GAS index experienced a decline of 0.47%, reflective of broader market uncertainties and fluctuating commodity prices. However, individual stock performances within the index unveil diverse narratives, with some companies resilient amidst challenges while others face regulatory scrutiny. Analyzing the NIFTY OIL & GAS index provides investors with insights into evolving energy landscapes and opportunities within this essential sector.

Option Chain Dynamics: Insights into Market Sentiment

Delving into the option chain data offers valuable insights into market sentiment and trader behavior. The fluctuations in open interest for both Nifty and BankNifty calls and puts paint a vivid picture of trader expectations and potential market directions. By dissecting these dynamics, traders can better anticipate market movements and adjust their strategies accordingly.

NIFTY Spot Analysis: The Heartbeat of the Market

At the core of market analysis lies the NIFTY Spot, serving as a compass for investor sentiment and market health. By closely monitoring NIFTY Spot movements, traders gain invaluable insights into market directionality and underlying strengths or weaknesses. Understanding the intricacies of NIFTY Spot dynamics is essential for navigating the unpredictable waters of the stock market.

Unveiling the Top Gainers and Losers: Insights into Market Performance

Exploring the top gainers and losers within the NIFTY and BANKNIFTY indices unveils the underlying currents shaping market performances. From stalwarts like HDFCBANK to emerging players, each stock’s trajectory provides valuable clues about sectoral trends and investor sentiment. By dissecting these performances, traders can identify potential opportunities and risks within the market landscape.

Interrogating Market Volatility: Strategies for Risk Mitigation

In the face of heightened market volatility, implementing robust risk mitigation strategies becomes imperative for traders. From diversification to hedging techniques, navigating turbulent market conditions requires a comprehensive approach. By adopting proactive risk management practices, traders can safeguard their portfolios and capitalize on emerging opportunities amidst market uncertainty.

Charting the Path Forward: Strategies for Adaptive Trading

As the market continues to evolve, adaptive trading strategies emerge as a cornerstone for success. From technical analysis to fundamental insights, staying agile in response to changing market dynamics is key. By embracing flexibility and continuously refining their approach, traders can navigate shifting market landscapes with confidence and resilience.

Conclusion: Navigating Uncertainty in the NSE Share Bazaar

The 12th of March 2024 showcased the unpredictable nature of the NSE Stock Market, marked by volatility and intrigue. As traders confront the mysteries of hidden sellers and market fluctuations, a proactive and informed approach is essential. By leveraging insights from option chain data, institutional movements, and sectoral analyses, traders can navigate uncertainty and seize opportunities amidst market turbulence. As the market journey continues, staying vigilant and adaptable remains paramount for success in the ever-evolving landscape of the NSE Share Bazaar.

By dissecting these dynamics, traders can better anticipate market movements and adjust their strategies accordingly.

Mystery Behind 12 March 2024: Who is the Hidden Seller in the Market? Read More »

Market Analysis FY24 | Unlocking Investment Opportunities: Insights from Ashish Gupta of Axis MF

Explore exclusive market analysis FY24, insights from Ashish Gupta, CIO of Axis Mutual Fund, on market trends, sector performance, and investment opportunities. Discover the potential of domestic cyclical and emerging sectors, guiding your investment strategy for success.

Market Analysis FY24: Economic Resurgence Driving Market Momentum

Ashish Gupta underscores the significant economic recovery witnessed in recent years, attributing it to robust GDP growth outperforming expectations. Despite concerns about market valuations, Gupta suggests that the market’s performance aligns with the projected earnings growth for the fiscal year. This indicates a sustained momentum in the market, driven by the prevailing economic conditions.

Also Read: Unlocking the Potential: How Bull Runs Transform Midcap & Smallcap Stocks

Capital Expenditure Resurgence: Key Sector Impacts

Gupta delves into the resurgence of capital expenditure (CAPEX) across various sectors, such as power, automobiles, and chemicals. He highlights the pivotal role of both government-led and private CAPEX initiatives in driving growth across these industries. The increase in CAPEX expenditure signals renewed confidence in India’s economic prospects, paving the way for sustained expansion and investment opportunities.

Market Analysis FY24

Cyclical Subcycle: Early Signs of Prosperity

In discussing the cyclical subcycle, Ashish Gupta emphasizes its nascent stage, suggesting potential multi-year upturns ahead. Despite the uptick in market multiples, Gupta remains optimistic, citing historical trends indicating prolonged cyclical phases. He suggests that the current cycle’s early stages, coupled with upcoming elections, present favorable conditions for investors to capitalize on emerging opportunities within cyclical sectors.

Also Read: Small Caps vs Large Caps

The term “cyclical subcycle” refers to a smaller, recurring pattern or phase within the broader economic cycle. Essentially, it represents the periodic ups and downs in economic activity that occur within the larger framework of economic expansion and contraction.

For instance, within the overall economic cycle, there are shorter-term fluctuations that impact specific sectors or industries. These fluctuations could be influenced by factors such as changes in consumer demand, shifts in business investment, or variations in government policy.

A classic example of a cyclical subcycle is the business cycle, which consists of four main phases: expansion, peak, contraction, and trough. Within this cycle, there are smaller fluctuations in economic activity that occur as the economy moves through these phases.

During an expansionary phase of the cyclical subcycle, economic activity and employment levels typically rise as businesses increase production to meet growing demand. Conversely, during a contractionary phase, economic activity slows down, leading to reduced production, job losses, and decreased consumer spending.

Understanding the cyclical subcycle is crucial for businesses, investors, and policymakers as it helps them anticipate changes in economic conditions and adjust their strategies accordingly. By recognizing where an economy stands within the cyclical subcycle, stakeholders can make informed decisions to navigate through periods of economic volatility and capitalize on opportunities for growth.

Also Read: Expert Analysis: Midcap Index is Overvalued

PSU Revival: Navigating Market Sentiment

Ashish Gupta sheds light on the revival of Public Sector Undertakings (PSUs), emphasizing their resurgence following a prolonged downturn. He attributes this turnaround to improvements in Return on Equity (ROE) and balance sheet restructuring efforts. Gupta’s insights highlight the evolving sentiment towards PSUs, with renewed investor interest driven by enhanced financial performance and strategic reforms.

Private Banks vs. PSUs: Evaluating Performance

A comparative analysis of private banks and PSUs reveals nuanced market dynamics and performance trajectories. Gupta discusses the contrasting fortunes of these sectors, acknowledging concerns over liquidity pressures impacting private banks. However, he remains optimistic, noting the gradual easing of liquidity constraints and its potential positive impact on private banks’ performance. This evaluation underscores the importance of monitoring liquidity trends and regulatory developments for informed investment decisions.

Global Economic Outlook: Impact on Domestic Growth

Gupta examines the global economic landscape and its implications for India’s domestic growth trajectory. He highlights the potential headwinds posed by weakening global growth, particularly in regions like China and Europe. Gupta emphasizes the need for vigilance in monitoring external factors, as they could influence India’s growth trajectory and market performance. This global perspective provides investors with valuable insights into the broader economic context shaping investment opportunities in India.

Sectoral Opportunities: Identifying Growth Drivers

Gupta identifies promising sectors poised for long-term growth, including manufacturing, consumer discretionary, power, and infrastructure. He elaborates on key growth drivers within these sectors, such as government initiatives, demographic trends, and technological advancements. Gupta’s analysis offers investors actionable insights into sectoral performance and potential investment avenues, guiding the strategic allocation of resources for optimal returns.

Also Read: Navigating Regulatory Challenges

Emerging Trends: Unveiling Alpha Opportunities

Uncovering emerging trends is crucial for identifying alpha opportunities in the market. Ashish Gupta highlights the transformative potential of infrastructure development and digitization, which are driving significant growth in various sectors. He underscores the importance of staying ahead of emerging trends to capitalize on untapped investment opportunities and achieve alpha returns. Gupta’s insights equip investors with the foresight needed to navigate evolving market landscapes and seize lucrative investment prospects.

Consumption Dynamics: Balancing Mass and Premium Segments

An in-depth examination of consumption dynamics reveals a nuanced interplay between mass and premium segments. Gupta discusses the rise of premiumization trends across sectors and forecasts a resurgence in mass consumption amid improving affordability. He identifies key factors influencing consumption patterns, such as inflation trends and income levels, offering valuable insights for investors seeking to capitalize on evolving consumer preferences. Gupta’s analysis underscores the importance of balancing investments across both mass and premium segments to maximize portfolio returns.

Future Perspectives: Charting the Path Ahead

Looking ahead, Ashish Gupta offers perspectives on the future trajectory of investment opportunities in the Indian market. He encourages investors to anticipate emerging trends and industry developments, empowering them to make informed decisions. By charting the path ahead, Gupta equips investors with the knowledge and foresight needed to navigate evolving market landscapes successfully. His insights serve as a valuable guide for investors seeking to unlock the full potential of investment opportunities in FY24 and beyond.

Market Analysis FY24 | Unlocking Investment Opportunities: Insights from Ashish Gupta of Axis MF Read More »

11 March 2024: Nifty 50 and BankNifty Analysis – Market Insights Revealed

Discover the latest trends in the NSE Share Market on 11 March 2024. Dive deep into Nifty and BankNifty today, explore option chain data, and unveil the impacts of FII/DII data movements.

Introduction: 11 March 2024 Day For Bears

Understanding the intricacies of the stock market is crucial for investors and traders alike. On March 11, 2024, the NSE Nifty Fifty and BankNifty showcased dynamic movements, offering valuable insights into market trends. This article delves into the detailed analysis of Nifty and BankNifty today, supplemented by option chain data and the influence of FII DII activity.

Today’s NSE Share Bazaar

Nifty 50 Today:

The NSE Nifty Fifty commenced its journey on 11 March 2024, with a notable gain of 24 points, opening at 22,517.50, indicating positive market sentiment. However, as the day progressed, the Nifty experienced fluctuations, reaching a high of 22,526.60 during the opening trade. Despite this, a slight decline was witnessed, with the Nifty spot touching a low of 22,370.00 around 12:10 PM. Following a brief recovery phase, the index encountered sharp selling pressure post-3 PM, resulting in a closing figure of 22,332.65, reflecting a 0.72% decline from the previous day’s close.

BankNifty Today:

Contrary to Nifty’s initial gains, BankNifty commenced trading on March 11, 2024, with a slight loss of 43 points, opening at 47,792.20. Despite reaching a high of 47,853.80 at the onset, BankNifty witnessed a decline, touching a day low of 47,230.65 around 2:20 PM. Although the index exhibited consolidation for the remaining trading hours, it closed at 47,327.85, indicating a 1.06% decrease from the previous close, portraying relative weakness compared to Nifty.

FII DII Data Analysis:

The activity of Foreign Institutional Investors (FIIs) and Domestic Institutional Investors (DIIs) significantly influences market movements. On 11 March 2024, FIIs exhibited bullish behavior by purchasing equities worth 4,212.76 crores in the cash segment, paralleled by DIIs, who also bought equities worth 3,238.39 crores. Despite this positive influx of funds, a disparity between institutional investments and market performance was observed, hinting at potential bulk deals. Additionally, the long-to-short ratio in FII Index futures decreased marginally from 0.72 to 0.71, indicating a subtle shift in trading sentiment.

FII Derivative Statistics for 11 March 2024

Feel free to snag the image below, showcasing the FII derivative statistics for 11 March 2024.

FII derivative stats For 11 March 2024

Top Gainers and Losers:

In the NSE Nifty Index, notable gainers on March 11, 2024, included APOLLOHOSP, NESTLEIND, and SBILIFE, while TATACONSUM, POWERGRID, and BAJAJ-AUTO emerged as top losers. Similarly, in the BankNifty Index, AUBANK showcased gains, whereas SBIN, INDUSINDBK, and BANDHANBNK faced losses, delineating sector-specific trends and investor sentiments.

Also Read:

Sectoral Analysis:

  • Nifty NEXT 50: The Nifty NEXT 50 index reflects the performance of the next set of 50 companies listed on the National Stock Exchange (NSE) after the Nifty 50. On 11 March 2024, this index opened at 60,467.45, exhibiting a marginal decrease from the previous close. Throughout the trading session, it experienced fluctuations, reaching a high of 60,920.25 and a low of 60,203.75. Finally, the index closed at 60,311.15, with a minor decline of 0.02%, indicating stable but subdued market sentiment within the NEXT 50 segment.
  • Nifty Midcap 100: The Nifty Midcap 100 index tracks the performance of the top 100 companies listed on the NSE, excluding those in the Nifty 50 index. On March 11, 2024, it opened at 49,194.60, displaying a modest decrease compared to the previous close. Throughout the trading session, the index witnessed varying highs and lows, reaching a peak of 49,201.20 and a trough of 48,697.35. Ultimately, it closed at 48,774.65, recording a decline of 0.39%, indicating a slightly bearish sentiment within the mid-cap segment.
  • Nifty Auto: The Nifty Auto index comprises companies from the automobile sector, reflecting the performance of this industry within the stock market. On 11 March 2024, it opened at 21,213.40, marking a decrease from the previous close. Throughout the trading session, the index experienced fluctuations, reaching a high of 21,219.85 and a low of 20,962.00. Finally, it closed at 21,001.15, depicting a decline of 0.59%, indicating subdued performance within the auto sector.
  • Nifty FMCG: The Nifty FMCG index represents the fast-moving consumer goods sector, encompassing companies that manufacture essential consumer products. On March 11, 2024, it opened at 53,914.00, displaying a slight decrease from the previous close. Throughout the trading session, the index showcased volatility, reaching a peak of 54,570.85 and a trough of 54,628.60. Ultimately, it closed at 53,970.25, recording a decline of 0.59%, indicating a relatively stable but bearish sentiment within the FMCG sector.
  • Nifty IT: The Nifty IT index comprises IT companies listed on the NSE, reflecting the performance of this sector within the stock market. On March 11, 2024, it opened at 37,082.00, experiencing a decrease from the previous close. Throughout the trading session, the index witnessed fluctuations, reaching a high of 37,203.85 and a low of 36,820.35. Finally, it closed at 36,988.30, depicting a decline of 0.30%, indicating a subdued performance within the IT sector.
  • Nifty Metal: The Nifty Metal index represents companies from the metal and mining sector, reflecting the performance of this industry within the stock market. On 11 March 2024, it opened at 8,407.80, displaying a decrease compared to the previous close. Throughout the trading session, the index experienced fluctuations, reaching a high of 8,410.25 and a low of 8,235.05. Ultimately, it closed at 8,250.75, recording a decline of 1.44%, indicating a bearish sentiment within the metal sector.
  • Nifty Pharma: The Nifty Pharma index comprises pharmaceutical companies listed on the NSE, reflecting the performance of this sector within the stock market. On March 11, 2024, it opened at 19,313.20, experiencing a marginal increase from the previous close. Throughout the trading session, the index witnessed fluctuations, reaching a high of 19,397.25 and a low of 19,173.80. Finally, it closed at 19,202.05, recording a slight increase of 0.04%, indicating relatively stable performance within the pharma sector.
  • Nifty PSU Bank: The Nifty PSU Bank index represents public sector banks listed on the NSE, reflecting the performance of this segment within the stock market. On 11 March 2024, it opened at 7,369.15, displaying a decrease compared to the previous close. Throughout the trading session, the index showcased volatility, reaching a high of 7,418.75 and a low of 7,205.00. Ultimately, it closed at 7,225.00, recording a decline of 1.58%, indicating bearish sentiments prevailing within the PSU banking sector.
  • Nifty Oil & Gas: The Nifty Oil & Gas index comprises companies from the oil and gas sector, reflecting the performance of this industry within the stock market. On March 11, 2024, it opened at 11,776.45, marking a decrease from the previous close. Throughout the trading session, the index experienced fluctuations, reaching a high of 11,827.55 and a low of 11,623.85. Finally, it closed at 11,643.55, recording a decline of 1.06%, indicating a bearish sentiment within the oil and gas sector.

Option Chain Insights – NIFTY:

Option chain data for the Nifty on March 14, 2024, expiry revealed notable changes in open interest calls and puts. Top changes in open interest calls included 22400CE, 22500CE, and 22300CE, while significant changes in open interest puts comprised 22200PE, 22400PE, and 22500PE. These insights provide valuable cues regarding market expectations and potential price levels.

Option Chain Insights – BANKNIFTY:

Similarly, the option chain data for BankNifty on March 13, 2024, expiry showcased significant changes in open interest calls and puts. Notable changes in open interest calls encompassed 47500CE, 47400CE, and 47300CE, while substantial changes in open interest puts featured 47300PE, 47400PE, and 47200PE. Understanding these shifts aids traders in devising effective strategies aligned with market sentiments.

Conclusion:

Analyzing the Nifty 50 and BankNifty movements, coupled with option chain data and FII DII insights, provides invaluable perspectives for investors navigating the dynamic landscape of the NSE Share Market. By deciphering market trends and sectoral performances, investors can make informed decisions, mitigating risks, and maximizing returns amidst evolving market conditions. Stay tuned for more updates and insights to navigate the intricate world of stock trading effectively.

11 March 2024: Nifty 50 and BankNifty Analysis – Market Insights Revealed Read More »

Scroll to Top