A Deep Dive into 13 March 2024 NSE Share Bazaar: Unveiling the Mystery of Unusual Market Movements
Explore the intriguing events of 13 March 2024 in the NSE Share Market, featuring the Nifty Fifty’s unexpected twists, the resilience of NiftyBank, and the enigmatic FII/DII data. Delve into the intricate details and uncover the secrets behind the market fluctuations.
The Opening Bell: A Promising Start
The 13th of March 2024 dawned with optimism in the NSE Share Bazaar as the Nifty Fifty showcased a promising opening, marking a significant gain of 97 points at 22,432.20 compared to the previous day’s close. However, the day’s events would soon take a tumultuous turn.
Rollercoaster Ride: Nifty Fifty’s Dramatic Fluctuations
On 13 March 2024, the Nifty opened with a gain of 97 points at 22,432.20 compared to the previous day’s close. However, the optimism was short-lived as the index experienced significant fluctuations throughout the trading session. The day saw the Nifty reaching a high of 22,446.75 at the opening but ultimately closing at 21,997.70, marking a loss of 1.51% from the previous day’s close.
Notable movements within the Nifty index included top gainers such as ITC, ICICIBANK, and KOTAKBANK, while top losers included POWERGRID, COALINDIA, and ADANIENT. These stocks played a significant role in influencing the index’s overall performance for the day.
The Resilient Banks: Saviors of the Day
On 13 March 2024, BankNifty opened with a gain of 59 points at 47,341.15 compared to the previous day’s close. Unlike the broader market, BankNifty exhibited relative strength and resilience throughout the trading session. The index reached a high of 47,468.70 and a low of 46,842.15 before closing at 46,981.30, marking a loss of -0.64% from the previous day’s close.
Heavyweight banks such as ICICIBANK, KOTAKBANK, and HDFCBANK played a significant role in influencing BankNifty’s performance for the day. However, there were notable underperformers as well, including BANDHANBNK, PNB, and BANKBARODA, which contributed to the index’s overall decline.
Institutional Influence: FII/DII Dynamics on 13 March 2024
The day witnessed intriguing activities in the FII/DII domain. Foreign Institutional Investors (FIIs) sold 4,595.06 crores in the cash segment, while Domestic Institutional Investors (DIIs) counteracted with a substantial purchase of 9,093.72 crores worth of equity. Despite concerted efforts by DIIs, the market remained volatile, raising questions about hidden market dynamics.
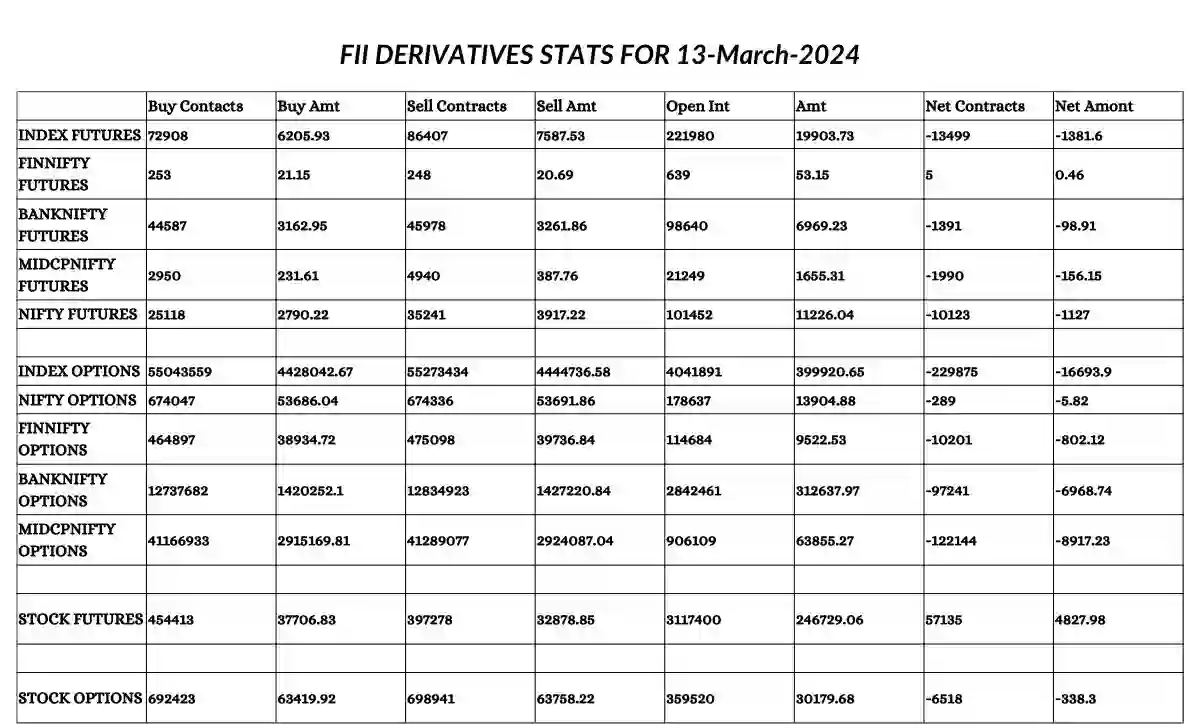
FII Derivative Statistics for 13 March 2024
You can save the image below for the FII derivative statistics for 13 March 2024.
Sectoral Insights: Unveiling the Real Picture
A closer examination of sectoral indices reveals the true extent of the market’s descent. While the headline index may reflect modest declines, sector-specific indices offer a more nuanced perspective, highlighting the breadth of the market turmoil.
Also Read:
- Relief Rally? 14 March 2024 NSE Share Bazaar
- Mystery Behind 12 March 2024
- 11 March 2024: Nifty 50 and BankNifty Analysis
The Curious Case of Nifty Options
Option chain data for Nifty presents a puzzle for market enthusiasts. Notable changes in open interest for both calls and puts hints at divergent market sentiments and potential strategies adopted by market participants.
Deciphering BankNifty Options
Similarly, the option chain data for BankNifty provides insights into market expectations and potential price movements. Significant changes in open interest for calls and puts underscore the intricate interplay of market forces.
Spectral Indices: Unraveling Market Segments
- NIFTY NEXT 50: The Nifty Next 50 index, comprising the next set of 50 stocks after the Nifty Fifty, opened at 59,466.80 on 13 March 2024. However, the day saw a significant downturn as it closed at 57,149.55, marking a substantial decrease of 3.75% from the previous day’s close at 59,377.20. High volatility was evident as the index experienced a wide range, with the highest point reaching 59,661.80 and the lowest dropping to 56,716.85. The Nifty Next 50’s performance is closely watched as it represents emerging companies with the potential to ascend to the prestigious Nifty Fifty index, providing insights into broader market sentiment and the trajectory of smaller-cap stocks.
- NIFTY MIDCAP 100: In contrast to the Nifty Next 50, the Nifty Midcap 100 index reflects the performance of the top 100 mid-sized companies listed on the NSE. On 13 March 2024, the index opened at 48,190.05 but closed significantly lower at 45,971.40, registering a decline of 4.4% from the previous day’s close at 48,086.85. Throughout the trading session, the index experienced fluctuations, with the highest point recorded at 48,278.00 and the lowest dropping to 45,656.85. The Nifty Midcap 100’s performance is closely monitored as it offers insights into the growth potential and resilience of mid-sized companies, often considered a barometer of economic health and investor sentiment.
- NIFTY AUTO: The Nifty Auto index, comprising stocks from the automobile sector, opened at 20,942.25 on 13 March 2024. However, the day saw a notable decline as it closed at 20,338.25, marking a decrease of 2.84% from the previous day’s close at 20,931.85. Throughout the trading session, the index experienced fluctuations, with the highest point reaching 20,988.55 and the lowest dropping to 20,211.20. The performance of the Nifty Auto index is closely tied to consumer demand, economic growth, and regulatory developments within the automotive industry, making it a key indicator of sectoral health and market sentiment.
- NIFTY FMCG: The Nifty FMCG index, comprising stocks from the fast-moving consumer goods sector, opened at 54,844.50 on 13 March 2024. Despite minor fluctuations, the index closed marginally higher at 53,664.15, registering a slight increase of 0.05% from the previous day’s close at 53,636.10. Throughout the trading session, the index reached a high of 54,962.50 and a low of 53,470.25. The performance of the Nifty FMCG index is closely monitored as it reflects consumer spending patterns, brand performance, and broader economic trends, providing insights into both domestic consumption and investor sentiment toward FMCG companies.
- NIFTY IT: The Nifty IT index, comprising stocks from the information technology sector, opened at 37,320.80 on 13 March 2024. However, the day saw a decline as it closed at 36,946.45, marking a decrease of 0.75% from the previous day’s close at 37,224.25. Throughout the trading session, the index experienced fluctuations, with the highest point recorded at 37,556.60 and the lowest dropping to 36,689.10. The performance of the Nifty IT index is closely linked to global technology trends, outsourcing demand, and currency fluctuations, making it a crucial indicator of India’s position in the global IT landscape and investor sentiment towards technology stocks.
- NIFTY METAL: The Nifty Metal index, comprising stocks from the metal sector, opened at 8,110.85 on 13 March 2024. However, the day saw a significant decline as it closed at 7,647.40, marking a decrease of 5.69% from the previous day’s close at 8,108.40. Throughout the trading session, the index experienced fluctuations, with the highest point recorded at 8,121.20 and the lowest dropping to 7,578.35. The performance of the Nifty Metal index is closely tied to global commodity prices, industrial demand, and macroeconomic factors, making it a key indicator of sectoral health and economic activity.
- NIFTY PHARMA: The Nifty Pharma index, comprising stocks from the pharmaceutical sector, opened at 19,219.30 on 13 March 2024. However, the day saw a decline as it closed at 18,495.00, marking a decrease of 1.70% from the previous day’s close at 18,635.70. Throughout the trading session, the index experienced fluctuations, with the highest point recorded at 18,961.20 and the lowest dropping to 19,022.20. The performance of the Nifty Pharma index is closely monitored as it reflects both domestic and international factors affecting the pharmaceutical industry, including regulatory developments, drug approvals, and healthcare trends.
- NIFTY PSU BANK: The Nifty PSU Bank index, comprising stocks from the public sector banks, opened at 7,054.55 on 13 March 2024. However, the day saw a decline as it closed at 6,737.45, marking a decrease of 4.28% from the previous day’s close at 7,039.00. Throughout the trading session, the index experienced fluctuations, with the highest point recorded at 7,088.25 and the lowest dropping to 6,683.15. The performance of the Nifty PSU Bank index is closely tied to government policies, economic indicators, and sector-specific developments, serving as a key indicator of the health of public sector banks and broader banking sector sentiment.
- NIFTY OIL & GAS: The Nifty Oil & Gas index, comprising stocks from the oil and gas sector, opened at 11,613.95 on 13 March 2024. However, the day saw a decline as it closed at 11,025.40, marking a decrease of 4.87% from the previous day’s close at 11,589.30. Throughout the trading session, the index experienced fluctuations, with the highest point recorded at 11,619.45 and the lowest dropping to 10,973.65. The performance of the Nifty Oil & Gas index is closely linked to global crude oil prices, geopolitical factors, and domestic policy decisions, making it a crucial indicator of sectoral health and energy market dynamics.
Top Performers and Underdogs
Identifying the top gainers and losers within the Nifty and BankNifty indices sheds light on prevailing market trends and sectoral dynamics, guiding investors in their decision-making processes.
The Aftermath: Implications and Future Outlook
As the dust settles on the 13th of March 2024, market participants reflect on the day’s events and anticipate the implications for future trading sessions. Uncertainties linger, but informed analysis and strategic positioning may pave the way for navigating turbulent market waters.
In conclusion, the events of 13 March 2024 in the NSE Share Bazaar offer a fascinating glimpse into the complexities of financial markets. From the Nifty Fifty’s dramatic fluctuations to the resilience of banking stocks and the enigmatic FII/DII data, each aspect unveils a piece of the larger puzzle, inviting further exploration and analysis in the ever-evolving landscape of the NSE Share Market.


